Plumber Hourly Pay in San Francisco, CA: $38.38 (2026)
Quick Answer:Hourly pay for a plumber working in San Francisco, CA runs $38.38 at the median for 2026 — annualizing to $79,843 at a standard 2,080-hour year. Figures projected from BLS OEWS 2025 (SOC 47-2152). Weighted against San Francisco's regional price level (BEA RPP 115.6, 16% above national), each hour of work buys what $33.20 nationally would. A 24-hour part-time schedule grosses $47,903 per year.
Official BLS data · View source
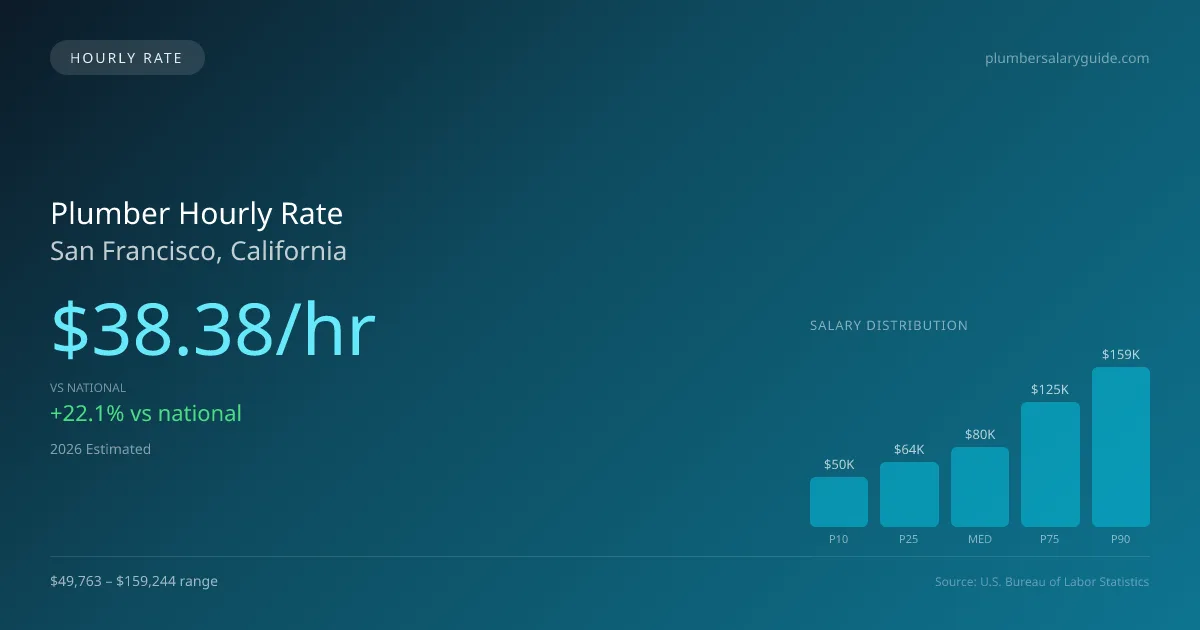
In San Francisco, the plumber hourly pay stands at a competitive $38.38, significantly higher than the national hourly median of $31.45. This rate offers a lucrative opportunity for both full-time professionals and those opting for part-time work, such as a 3-day workweek. Part-time plumbers can expect to earn approximately $24,000 if they work 24 hours weekly, allowing for a good work-life balance while still securing a reliable income stream in settings like residential service calls or commercial construction projects. The hourly pay range notably spans from $23.93 for entry-level positions to an impressive $76.56 for the most experienced plumbers, catering to a diverse workforce that includes self-employed contractors and union workers specializing in medical gas and backflow prevention.
Plumber Hourly Wage Breakdown
| Percentile | Hourly Rate | Per 8hr Shift |
|---|---|---|
| Entry Level (P10) | $23.93 | $191.43 |
| Lower Range (P25) | $30.88 | $247.03 |
| Median (P50) | $38.38 | $307.07 |
| Upper Range (P75) | $60.02 | $480.12 |
| Top Earners (P90) | $76.56 | $612.50 |
Estimated Annual Income by Work Schedule in San Francisco
Based on $38.38/hr median hourly rate · 2026 est.
At $38.38/hr, a plumber working full-time (40 hr/wk) in San Francisco, CA can expect to earn approximately $79,838 per year (2026 est.). Part-time hygienists working 24 hours per week would earn around $46,060. With a cost-of-living index of 115.61 (above the national average), these earnings may be offset by higher expenses in San Francisco.
Hourly Rate Calculator
Schedule Comparison in San Francisco
| Schedule | Weekly | Monthly | Annual |
|---|---|---|---|
| Full-Time (40 hrs) | $1,535.34 | $6,653 | $79,838 |
| Part-Time (24 hrs) | $921.20 | $3,992 | $47,903 |
| Per Diem (16 hrs) | $614.14 | $2,661 | $31,935 |
Compare Plumber Wages With Similar Roles
| Role | Median Hourly |
|---|---|
| Plumber (San Francisco) | $38.38 |
| Electrician (National Avg) | $31.97 |
| HVAC Technician (National Avg) | $28.47 |
| Pipefitter / Steamfitter (National Avg) | $32.85 |
| Construction Laborer (National Avg) | $22.95 |
Plumbers in San Francisco, CA earn a median of $79,843 per year (2026 est.), which is 22.07% higher than the national median of $65,408 and 21.80% above the California state average of $65,552.
Plumber Hourly Pay vs. Cost of Living
Working 24h/week at $38.38/hr = $47,903/year (purchasing power: $41,434).
Working 40h/week (full-time) = $79,838/year (purchasing power: $69,056).
CoL index: 115.613 (100 = national average).
2019 BLS Actual
$37.40/hr
2025 BLS Actual
$37.44/hr
2026 Current Est.
$38.38/hr
2019–2027 Growth
+5.2%
Hourly Rate Trajectory for Plumbers in San Francisco (2019–2027)
2019–2025: actual BLS OEWS data for this metro area. 2026+: CAGR 2.52% projection.
| Year | Hourly Rate | Status |
|---|---|---|
| 2019 | $37.40/hr | Actual |
| 2020 | $53.31/hr | Actual |
| 2021 | $37.89/hr | Actual |
| 2022 | $36.99/hr | Actual |
| 2023 | $36.46/hr | Actual |
| 2024 | $34.47/hr | Actual |
| 2025 | $37.44/hr | Actual |
| 2026(current) | $38.38/hr | Estimated |
| 2027 | $39.35/hr | Projected |
Based on 7 years of BLS OEWS metropolitan area data, the median hourly rate for plumbers in San Francisco grew 0.1% from $37.40/hr (2019) to $37.44/hr (2025). At a 2.52% projected growth rate, hourly pay is expected to reach $39.35/hr by 2027. Part-time and per-diem plumbers can use this multi-year trend to benchmark future contract negotiations.
Note: Historical values (2019–2025) are actual BLS OEWS figures for the San Francisco metropolitan area, sourced from annual Occupational Employment and Wage Statistics surveys. 2026–2026 figures are current estimates, and 2027 values are projections, calculated using a 2.52% CAGR derived from 7-year BLS historical data. Actual salaries may vary based on employer, experience, certifications, and local market conditions.
Working as an Hourly Plumber in San Francisco
Considering the dynamics of part-time and per diem work, a plumber who chooses to work three days a week can pocket a comfortable income but may find it substantially less than full-time peers. Per diem plumber pay in San Francisco can be especially lucrative; those engaged in out-of-town industrial projects often command $100-$175 per day on top of hourly wages ranging from $40 to $65. For service calls, plumbing companies typically charge between $150 and $300 just for the initial visit, creating opportunities for substantial earnings. The ranges can fluctuate further depending on whether a plumber is unionized, self-employed, or works for a larger service company. While some may accept lower hourly rates for the benefits that union jobs provide, self-employed plumbers targeting high-cost markets can clear between $100 and $180 per hour. Practical negotiation skills are essential for hourly workers to maximize their earnings, particularly within San Francisco's competitive labor market.
More salary data for San Francisco, CA:
Frequently Asked Questions
What is the hourly rate for plumbers in San Francisco in 2026?
How much do part-time plumbers make in San Francisco?
Are plumbers in San Francisco paid hourly or salary?
How much does a full-time plumber make per year in San Francisco?
Do plumbers earn more per hour working part-time in San Francisco?
Related Pages
Compare Salaries
Career Resources
Nearby Cities in California
Written by Samuel Torres, CWP
Career Analyst
Samuel Torres has 10 years of experience in plumbing. He specializes in residential plumbing systems. He has worked with several home improvement companies.
Methodology & Data Source
Hourly wage figures on this page are 2026 projections based on the Bureau of Labor Statistics Occupational Employment and Wage Statistics (OEWS) survey, May 2026 release. A 2.52% compound annual growth rate (CAGR), derived from 6-year national BLS wage trends, was applied to estimate current 2026 hourly rates for plumbers in San Francisco. Part-time and full-time income estimates assume consistent weekly hours and do not account for overtime, benefits, or seasonal variation.
Data Sources & Methodology
Source: BLS, OEWS, 7-year dataset (–). Per-city data from annual BLS metropolitan area surveys.
2026 figures are projected from 2025 BLS data using a compound annual growth rate (CAGR) of 2.52%, derived from historical BLS wage trends for plumbers (SOC 47-2152).
Compiled and verified by Samuel Torres, CWP, a licensed plumber with 10+ years of clinical experience. · View source data at BLS.gov