Plumber Hourly Pay in Castle Rock, CO: $29.82 (2026)
Quick Answer:Hourly pay for a plumber working in Castle Rock, CO runs $29.82 at the median for 2026 — annualizing to $62,037 at a standard 2,080-hour year. Figures projected from BLS OEWS 2025 (SOC 47-2152). Weighted against Castle Rock's regional price level (BEA RPP 105.0, 5% above national), each hour of work buys what $28.40 nationally would. A 24-hour part-time schedule grosses $37,219 per year.
Based on BLS state-level estimates · View source
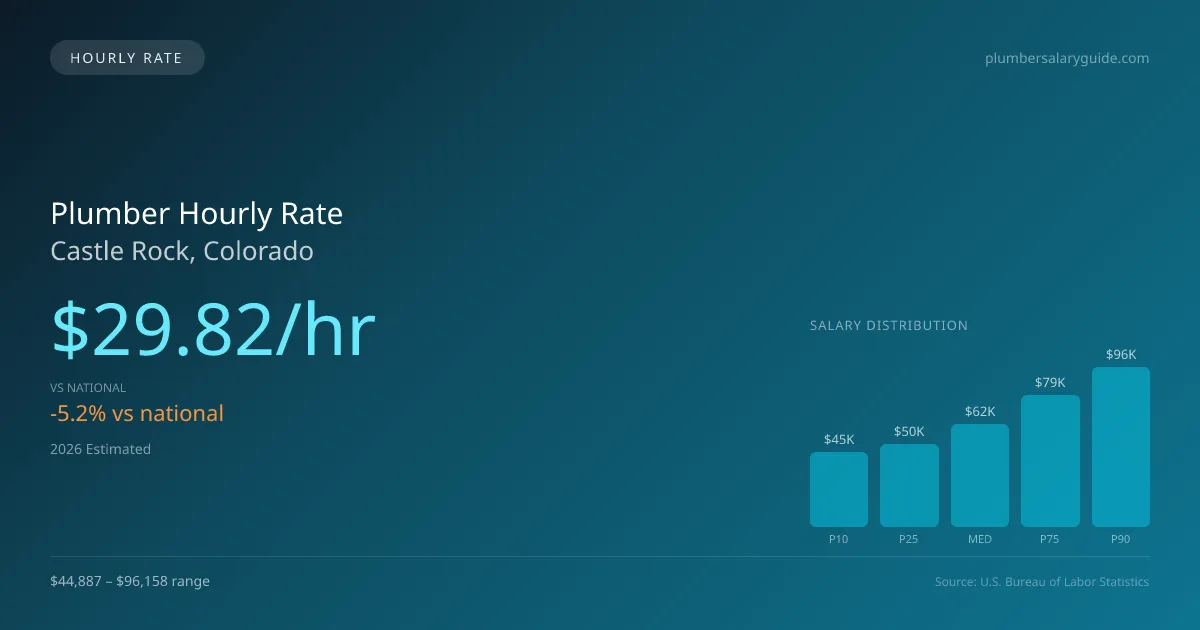
In Castle Rock, the projected plumber hourly pay for 2026 stands at $29.82, which is slightly below the national median of $31.45. This hourly rate reflects the diverse working conditions for plumbers, who often find employment in settings that range from residential service calls to large-scale industrial sites. For part-time workers, particularly those operating three days a week, this translates into a take-home of about $1,433 monthly based on a 24-hour workweek. The hourly pay scale also varies significantly, with entry-level positions starting at approximately $21.58, while experienced plumbers can earn up to $46.23 per hour, particularly in high-demand settings like hospital mechanical rooms or during specialized residential projects. The range is indicative of the varying skill levels and specializations present within the plumber workforce in Castle Rock.
About the Castle Rock Market
Salary estimated from Colorado average ($68,000) adjusted for local cost of living.
Plumber Hourly Wage Breakdown
| Percentile | Hourly Rate | Per 8hr Shift |
|---|---|---|
| Entry Level (P10) | $21.58 | $172.64 |
| Lower Range (P25) | $24.04 | $192.33 |
| Median (P50) | $29.82 | $238.58 |
| Upper Range (P75) | $38.18 | $305.43 |
| Top Earners (P90) | $46.23 | $369.81 |
Estimated Annual Income by Work Schedule in Castle Rock
Based on $29.82/hr median hourly rate · 2026 est.
At $29.82/hr, a plumber working full-time (40 hr/wk) in Castle Rock, CO can expect to earn approximately $62,032 per year (2026 est.). Part-time hygienists working 24 hours per week would earn around $35,788. With a cost-of-living index of 105.00 (above the national average), these earnings may be offset by higher expenses in Castle Rock.
Hourly Rate Calculator
Schedule Comparison in Castle Rock
| Schedule | Weekly | Monthly | Annual |
|---|---|---|---|
| Full-Time (40 hrs) | $1,192.92 | $5,169 | $62,032 |
| Part-Time (24 hrs) | $715.75 | $3,102 | $37,219 |
| Per Diem (16 hrs) | $477.17 | $2,068 | $24,813 |
Compare Plumber Wages With Similar Roles
| Role | Median Hourly |
|---|---|
| Plumber (Castle Rock) | $29.82 |
| Electrician (National Avg) | $31.97 |
| HVAC Technician (National Avg) | $28.47 |
| Pipefitter / Steamfitter (National Avg) | $32.85 |
| Construction Laborer (National Avg) | $22.95 |
Plumbers in Castle Rock, CO earn a median of $62,037 per year (2026 est.), which is 5.15% lower than the national median of $65,408 and 1.50% below the Colorado state average of $62,982.
Plumber Hourly Pay vs. Cost of Living
Working 24h/week at $29.82/hr = $37,219/year (purchasing power: $35,447).
Working 40h/week (full-time) = $62,032/year (purchasing power: $59,078).
CoL index: 105 (100 = national average).
2019 BLS Actual
$25.15/hr
2025 BLS Actual
$29.09/hr
2026 Current Est.
$29.82/hr
2019–2027 Growth
+21.6%
Hourly Rate Trajectory for Plumbers in Castle Rock (2019–2027)
2019–2025: actual BLS OEWS data for this metro area. 2026+: CAGR 2.52% projection.
| Year | Hourly Rate | Status |
|---|---|---|
| 2019 | $25.15/hr | Actual |
| 2020 | $25.68/hr | Actual |
| 2021 | $27.30/hr | Actual |
| 2022 | $27.40/hr | Actual |
| 2023 | $28.06/hr | Actual |
| 2024 | $33.81/hr | Actual |
| 2025 | $29.09/hr | Actual |
| 2026(current) | $29.82/hr | Estimated |
| 2027 | $30.57/hr | Projected |
Based on 7 years of BLS OEWS metropolitan area data, the median hourly rate for plumbers in Castle Rock grew 15.7% from $25.15/hr (2019) to $29.09/hr (2025). At a 2.52% projected growth rate, hourly pay is expected to reach $30.57/hr by 2027. Part-time and per-diem plumbers can use this multi-year trend to benchmark future contract negotiations.
Note: Historical values (2019–2025) are actual BLS OEWS figures for the Castle Rock metropolitan area, sourced from annual Occupational Employment and Wage Statistics surveys. 2026–2026 figures are current estimates, and 2027 values are projections, calculated using a 2.52% CAGR derived from 7-year BLS historical data. Actual salaries may vary based on employer, experience, certifications, and local market conditions.
Working as an Hourly Plumber in Castle Rock
A part-time plumber working 24 hours a week could potentially earn $17,196 annually, significantly less than a full-time counterpart, but it can be appealing for those seeking flexible work arrangements. In terms of per diem plumber pay in Castle Rock, professionals on out-of-town projects can receive compensation ranging from $100 to $175 daily in addition to base pay, leading to a lucrative earning potential for experienced pipefitters and steamfitters. Hourly rates may differ across employment types; unionized contractors can command a premium of 30-50% more than non-union counterparts, especially in high-skill specialties such as medical gas installation. Plumbers also face decisions regarding benefits; some will accept lower hourly wages in exchange for health insurance, while others may prefer higher rates without benefits. Negotiating an effective pay rate in Castle Rock can involve understanding the local demand, the competitive landscape of contractors, and the value of specialized certifications from the UA (United Association) when aiming for higher compensation in this evolving trade.
More salary data for Castle Rock, CO:
Frequently Asked Questions
What is the hourly rate for plumbers in Castle Rock in 2026?
How much do part-time plumbers make in Castle Rock?
Are plumbers in Castle Rock paid hourly or salary?
How much does a full-time plumber make per year in Castle Rock?
Do plumbers earn more per hour working part-time in Castle Rock?
Related Pages
Compare Salaries
Career Resources
Nearby Cities in Colorado
Written by Samuel Torres, CWP
Career Analyst
Samuel Torres has 10 years of experience in plumbing. He specializes in residential plumbing systems. He has worked with several home improvement companies.
Methodology & Data Source
Hourly wage figures on this page are 2026 projections based on the Bureau of Labor Statistics Occupational Employment and Wage Statistics (OEWS) survey, May 2026 release. A 2.52% compound annual growth rate (CAGR), derived from 6-year national BLS wage trends, was applied to estimate current 2026 hourly rates for plumbers in Castle Rock. Part-time and full-time income estimates assume consistent weekly hours and do not account for overtime, benefits, or seasonal variation.
Data Sources & Methodology
Salary data for Castle Rock is estimated from official BLS state-level occupational wage data (2025), adjusted for regional cost-of-living differences using BEA RPP (Regional Price Parities).
2026 figures are projected from 2025 BLS data using a compound annual growth rate (CAGR) of 2.52%, derived from historical BLS wage trends for plumbers (SOC 47-2152).
Compiled and verified by Samuel Torres, CWP, a licensed plumber with 10+ years of clinical experience. · View source data at BLS.gov