Plumber Hourly Pay in Vineland, NJ: $37.98 (2026)
Quick Answer:Hourly pay for a plumber working in Vineland, NJ runs $37.98 at the median for 2026 — annualizing to $79,002 at a standard 2,080-hour year. Figures projected from BLS OEWS 2025 (SOC 47-2152). Weighted against Vineland's regional price level (BEA RPP 96.0, 4% below national), each hour of work buys what $39.58 nationally would. A 24-hour part-time schedule grosses $47,404 per year.
Official BLS data · View source
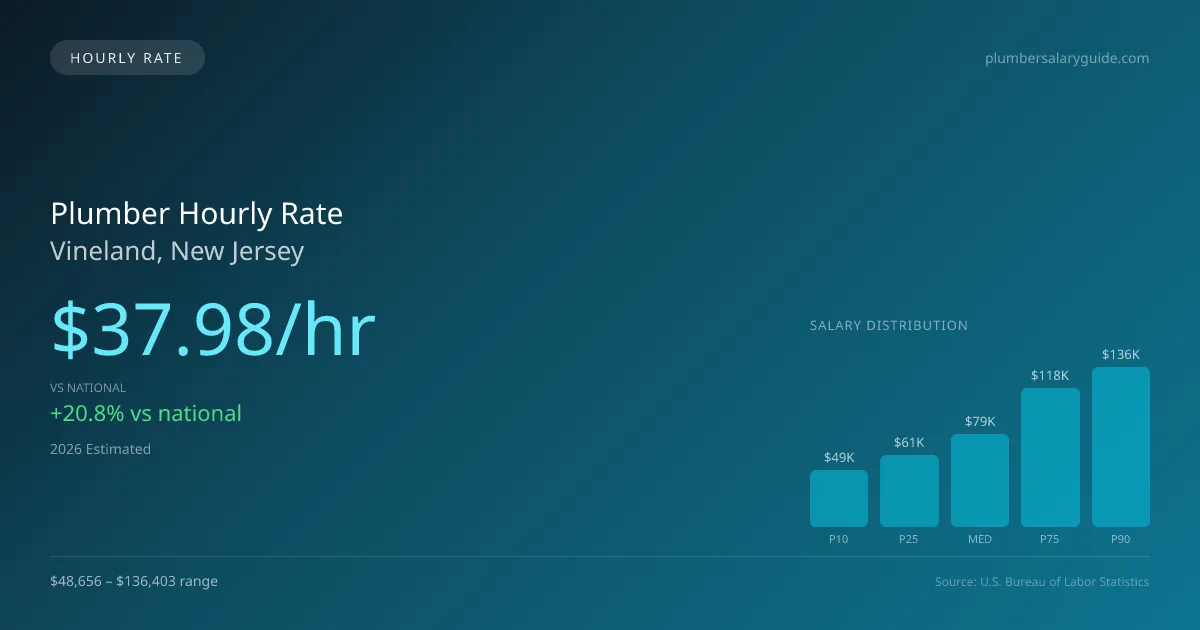
With a median hourly pay of $37.98, plumbers in Vineland, NJ, are positioned significantly ahead of the national average of $31.45. This elevated rate can provide part-time workers, such as those working three days a week, with a solid income while still allowing for flexibility. For someone working this schedule, totaling approximately 24 hours a week, the hourly compensation translates into a respectable weekly paycheck, making it possible to cover living expenses in a region with a cost of living index below the national average. Entry-level plumbers can expect to earn around $23.40 per hour, while top earners in Vineland can command up to $65.58 per hour, reflecting the diverse work settings that include residential service calls, commercial projects, and industrial environments. This data is based on projections from the 2025 Bureau of Labor Statistics (BLS) figures, giving aspiring plumbers a clear picture of potential financial rewards in their chosen field.
Plumber Hourly Wage Breakdown
| Percentile | Hourly Rate | Per 8hr Shift |
|---|---|---|
| Entry Level (P10) | $23.40 | $187.16 |
| Lower Range (P25) | $29.57 | $236.53 |
| Median (P50) | $37.98 | $303.87 |
| Upper Range (P75) | $56.92 | $455.35 |
| Top Earners (P90) | $65.58 | $524.66 |
Estimated Annual Income by Work Schedule in Vineland
Based on $37.98/hr median hourly rate · 2026 est.
At $37.98/hr, a plumber working full-time (40 hr/wk) in Vineland, NJ can expect to earn approximately $79,006 per year (2026 est.). Part-time hygienists working 24 hours per week would earn around $45,580. With a cost-of-living index of 95.97 (below the national average), these earnings stretch further in Vineland.
Hourly Rate Calculator
Schedule Comparison in Vineland
| Schedule | Weekly | Monthly | Annual |
|---|---|---|---|
| Full-Time (40 hrs) | $1,519.35 | $6,584 | $79,006 |
| Part-Time (24 hrs) | $911.61 | $3,950 | $47,404 |
| Per Diem (16 hrs) | $607.74 | $2,634 | $31,602 |
Compare Plumber Wages With Similar Roles
| Role | Median Hourly |
|---|---|
| Plumber (Vineland) | $37.98 |
| Electrician (National Avg) | $31.97 |
| HVAC Technician (National Avg) | $28.47 |
| Pipefitter / Steamfitter (National Avg) | $32.85 |
| Construction Laborer (National Avg) | $22.95 |
Plumbers in Vineland, NJ earn a median of $79,002 per year (2026 est.), which is 20.78% higher than the national median of $65,408 and 4.80% above the New Jersey state average of $75,384.
Plumber Hourly Pay vs. Cost of Living
Working 24h/week at $37.98/hr = $47,404/year (purchasing power: $49,395).
Working 40h/week (full-time) = $79,006/year (purchasing power: $82,325).
CoL index: 95.968 (100 = national average). Your dollars stretch further here.
2019 BLS Actual
$29.19/hr
2025 BLS Actual
$37.05/hr
2026 Current Est.
$37.98/hr
2019–2027 Growth
+33.4%
Hourly Rate Trajectory for Plumbers in Vineland (2019–2027)
2019–2025: actual BLS OEWS data for this metro area. 2026+: CAGR 2.52% projection.
| Year | Hourly Rate | Status |
|---|---|---|
| 2019 | $29.19/hr | Actual |
| 2020 | $34.30/hr | Actual |
| 2021 | $47.94/hr | Actual |
| 2022 | $51.53/hr | Actual |
| 2023 | $38.17/hr | Actual |
| 2024 | $36.97/hr | Actual |
| 2025 | $37.05/hr | Actual |
| 2026(current) | $37.98/hr | Estimated |
| 2027 | $38.94/hr | Projected |
Based on 7 years of BLS OEWS metropolitan area data, the median hourly rate for plumbers in Vineland grew 26.9% from $29.19/hr (2019) to $37.05/hr (2025). At a 2.52% projected growth rate, hourly pay is expected to reach $38.94/hr by 2027. Part-time and per-diem plumbers can use this multi-year trend to benchmark future contract negotiations.
Note: Historical values (2019–2025) are actual BLS OEWS figures for the Vineland metropolitan area, sourced from annual Occupational Employment and Wage Statistics surveys. 2026–2026 figures are current estimates, and 2027 values are projections, calculated using a 2.52% CAGR derived from 7-year BLS historical data. Actual salaries may vary based on employer, experience, certifications, and local market conditions.
Working as an Hourly Plumber in Vineland
Working part-time as a plumber can yield an annual take-home pay substantially different from full-time wages. A plumber working an average of 24 hours weekly could expect to bring home approximately $47,216 annually, compared to full-time equivalents making around $79,002. Per diem plumbing opportunities, especially prevalent among travel pipefitters, can offer significant boosts to earnings; these workers typically receive additional compensation of $100-$175 per day plus a base hourly wage of $40-$65, making this a lucrative option for those willing to take on travel assignments. Local competition impacts hourly rates across various employers, with union plumbers often earning a premium over their non-union counterparts. While some may choose lower steady pay for employee benefits, self-employed plumbers who navigate the high-cost landscape generally aim for effective rates of $100-$180 per hour. Understanding these dynamics and honing negotiation skills can result in more favorable working conditions and pay structures in Vineland for dedicated plumbing professionals.
More salary data for Vineland, NJ:
Frequently Asked Questions
What is the hourly rate for plumbers in Vineland in 2026?
How much do part-time plumbers make in Vineland?
Are plumbers in Vineland paid hourly or salary?
How much does a full-time plumber make per year in Vineland?
Do plumbers earn more per hour working part-time in Vineland?
Related Pages
Compare Salaries
Career Resources
Nearby Cities in New Jersey
Written by Samuel Torres, CWP
Career Analyst
Samuel Torres has 10 years of experience in plumbing. He specializes in residential plumbing systems. He has worked with several home improvement companies.
Methodology & Data Source
Hourly wage figures on this page are 2026 projections based on the Bureau of Labor Statistics Occupational Employment and Wage Statistics (OEWS) survey, May 2026 release. A 2.52% compound annual growth rate (CAGR), derived from 6-year national BLS wage trends, was applied to estimate current 2026 hourly rates for plumbers in Vineland. Part-time and full-time income estimates assume consistent weekly hours and do not account for overtime, benefits, or seasonal variation.
Data Sources & Methodology
Source: BLS, OEWS, 7-year dataset (–). Per-city data from annual BLS metropolitan area surveys.
2026 figures are projected from 2025 BLS data using a compound annual growth rate (CAGR) of 2.52%, derived from historical BLS wage trends for plumbers (SOC 47-2152).
Compiled and verified by Samuel Torres, CWP, a licensed plumber with 10+ years of clinical experience. · View source data at BLS.gov