Plumber Hourly Pay in Westerville, OH: $30.63 (2026)
Quick Answer:Hourly pay for a plumber working in Westerville, OH runs $30.63 at the median for 2026 — annualizing to $63,710 at a standard 2,080-hour year. Figures projected from BLS OEWS 2025 (SOC 47-2152). Weighted against Westerville's regional price level (BEA RPP 90.7, 9% below national), each hour of work buys what $33.77 nationally would. A 24-hour part-time schedule grosses $38,230 per year.
Based on BLS state-level estimates · View source
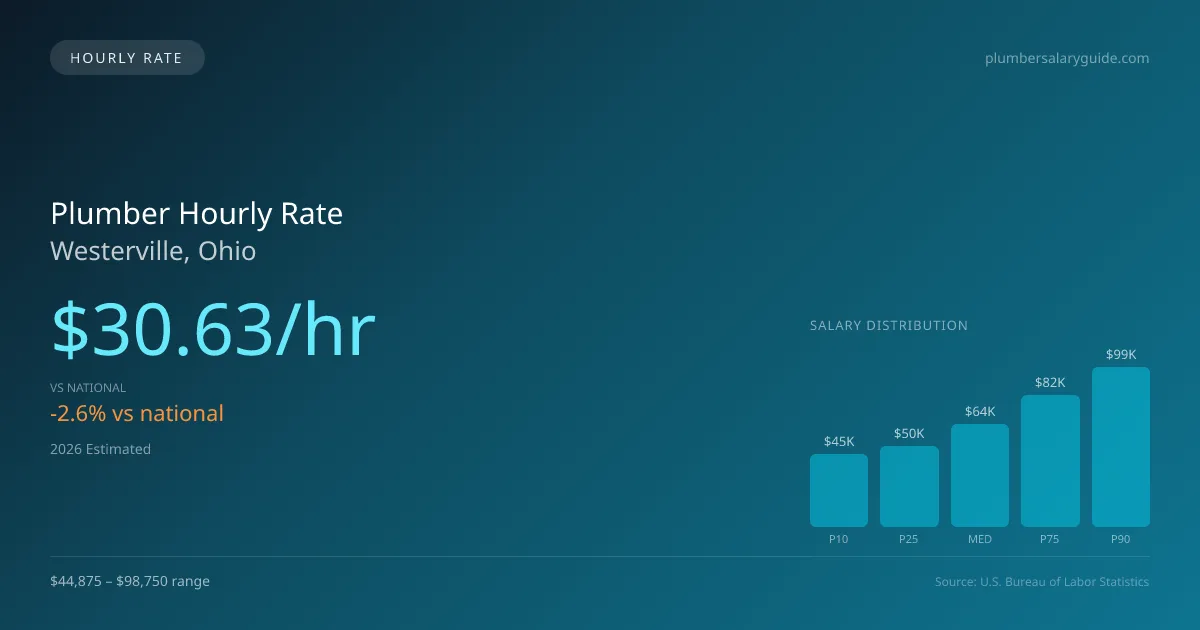
In Westerville, Ohio, the plumber hourly pay is projected to reach a median of $30.63 in 2026. This figure is slightly below the national median hourly rate of $31.45, indicating that while Westerville offers competitive wages, there is room for growth compared to other regions. For part-time plumbers working three days a week, this hourly rate translates to approximately $38,680 annually, making it a viable option for those pursuing flexible schedules. The hourly wage range is significant, with entry-level positions starting around $21.57 and experienced plumbers potentially earning as much as $47.48. This diverse pay scale reflects the varied nature of work in the field, including residential service calls, commercial installations, and specialized roles in hospital mechanical rooms, which are critical yet less frequently staffed.
About the Westerville Market
Salary estimated from Ohio average ($66,000) adjusted for local cost of living.
Plumber Hourly Wage Breakdown
| Percentile | Hourly Rate | Per 8hr Shift |
|---|---|---|
| Entry Level (P10) | $21.57 | $172.56 |
| Lower Range (P25) | $24.03 | $192.25 |
| Median (P50) | $30.63 | $245.06 |
| Upper Range (P75) | $39.20 | $313.63 |
| Top Earners (P90) | $47.48 | $379.82 |
Estimated Annual Income by Work Schedule in Westerville
Based on $30.63/hr median hourly rate · 2026 est.
At $30.63/hr, a plumber working full-time (40 hr/wk) in Westerville, OH can expect to earn approximately $63,717 per year (2026 est.). Part-time hygienists working 24 hours per week would earn around $36,760. With a cost-of-living index of 90.70 (below the national average), these earnings stretch further in Westerville.
Hourly Rate Calculator
Schedule Comparison in Westerville
| Schedule | Weekly | Monthly | Annual |
|---|---|---|---|
| Full-Time (40 hrs) | $1,225.32 | $5,310 | $63,717 |
| Part-Time (24 hrs) | $735.19 | $3,186 | $38,230 |
| Per Diem (16 hrs) | $490.13 | $2,124 | $25,487 |
Compare Plumber Wages With Similar Roles
| Role | Median Hourly |
|---|---|
| Plumber (Westerville) | $30.63 |
| Electrician (National Avg) | $31.97 |
| HVAC Technician (National Avg) | $28.47 |
| Pipefitter / Steamfitter (National Avg) | $32.85 |
| Construction Laborer (National Avg) | $22.95 |
Plumbers in Westerville, OH earn a median of $63,710 per year (2026 est.), which is 2.60% lower than the national median of $65,408 and 1.30% below the Ohio state average of $64,549.
Plumber Hourly Pay vs. Cost of Living
Working 24h/week at $30.63/hr = $38,230/year (purchasing power: $42,150).
Working 40h/week (full-time) = $63,717/year (purchasing power: $70,250).
CoL index: 90.7 (100 = national average). Your dollars stretch further here.
2019 BLS Actual
$25.83/hr
2025 BLS Actual
$29.88/hr
2026 Current Est.
$30.63/hr
2019–2027 Growth
+21.6%
Hourly Rate Trajectory for Plumbers in Westerville (2019–2027)
2019–2025: actual BLS OEWS data for this metro area. 2026+: CAGR 2.52% projection.
| Year | Hourly Rate | Status |
|---|---|---|
| 2019 | $25.83/hr | Actual |
| 2020 | $26.38/hr | Actual |
| 2021 | $28.04/hr | Actual |
| 2022 | $28.14/hr | Actual |
| 2023 | $28.83/hr | Actual |
| 2024 | $28.40/hr | Actual |
| 2025 | $29.88/hr | Actual |
| 2026(current) | $30.63/hr | Estimated |
| 2027 | $31.40/hr | Projected |
Based on 7 years of BLS OEWS metropolitan area data, the median hourly rate for plumbers in Westerville grew 15.7% from $25.83/hr (2019) to $29.88/hr (2025). At a 2.52% projected growth rate, hourly pay is expected to reach $31.40/hr by 2027. Part-time and per-diem plumbers can use this multi-year trend to benchmark future contract negotiations.
Note: Historical values (2019–2025) are actual BLS OEWS figures for the Westerville metropolitan area, sourced from annual Occupational Employment and Wage Statistics surveys. 2026–2026 figures are current estimates, and 2027 values are projections, calculated using a 2.52% CAGR derived from 7-year BLS historical data. Actual salaries may vary based on employer, experience, certifications, and local market conditions.
Working as an Hourly Plumber in Westerville
Employment opportunities in Westerville can also provide unique earning scenarios for plumbers, especially those seeking per diem work or agency positions. A plumber working three days a week would earn $38,680, while full-time workers could accumulate around $63,710 annually. For those traveling for work, per diem plumber pay in Westerville often includes daily stipends ranging from $100 to $175 on top of base hourly rates that can range between $40 and $65. Various employers, such as union contractors, non-union firms, and large service companies, offer different hourly rates influenced by whether health benefits are included. Union positions typically command a higher hourly rate, providing a premium for those with specialized skills. Moreover, self-employed plumbers often set their prices based on project demands and market conditions, making them capable of charging $100 to $180 per hour in high-cost-of-living environments. Negotiating pay effectively in Westerville requires an understanding of these dynamics, ensuring that hourly workers can advocate for compensation that reflects their expertise and the local market conditions.
More salary data for Westerville, OH:
Frequently Asked Questions
What is the hourly rate for plumbers in Westerville in 2026?
How much do part-time plumbers make in Westerville?
Are plumbers in Westerville paid hourly or salary?
How much does a full-time plumber make per year in Westerville?
Do plumbers earn more per hour working part-time in Westerville?
Related Pages
Compare Salaries
Career Resources
Nearby Cities in Ohio
Written by Samuel Torres, CWP
Career Analyst
Samuel Torres has 10 years of experience in plumbing. He specializes in residential plumbing systems. He has worked with several home improvement companies.
Methodology & Data Source
Hourly wage figures on this page are 2026 projections based on the Bureau of Labor Statistics Occupational Employment and Wage Statistics (OEWS) survey, May 2026 release. A 2.52% compound annual growth rate (CAGR), derived from 6-year national BLS wage trends, was applied to estimate current 2026 hourly rates for plumbers in Westerville. Part-time and full-time income estimates assume consistent weekly hours and do not account for overtime, benefits, or seasonal variation.
Data Sources & Methodology
Salary data for Westerville is estimated from official BLS state-level occupational wage data (2025), adjusted for regional cost-of-living differences using BEA RPP (Regional Price Parities).
2026 figures are projected from 2025 BLS data using a compound annual growth rate (CAGR) of 2.52%, derived from historical BLS wage trends for plumbers (SOC 47-2152).
Compiled and verified by Samuel Torres, CWP, a licensed plumber with 10+ years of clinical experience. · View source data at BLS.gov