Plumber Salary in Beaumont, CA: $63,679 (2026)
Quick Answer:A full-time plumber in Beaumont, CA earns a median $63,679/year (≈ $30.61/hour) in nominal terms for 2026 — projected from BLS OEWS 2025 (SOC 47-2152). Once you factor in Beaumont's price level (13% above national, BEA RPP 113.1), that paycheck buys what $56,303 would nationally. Nominal pay sits 2.8% below the California state average.
Based on BLS state-level estimates · View source
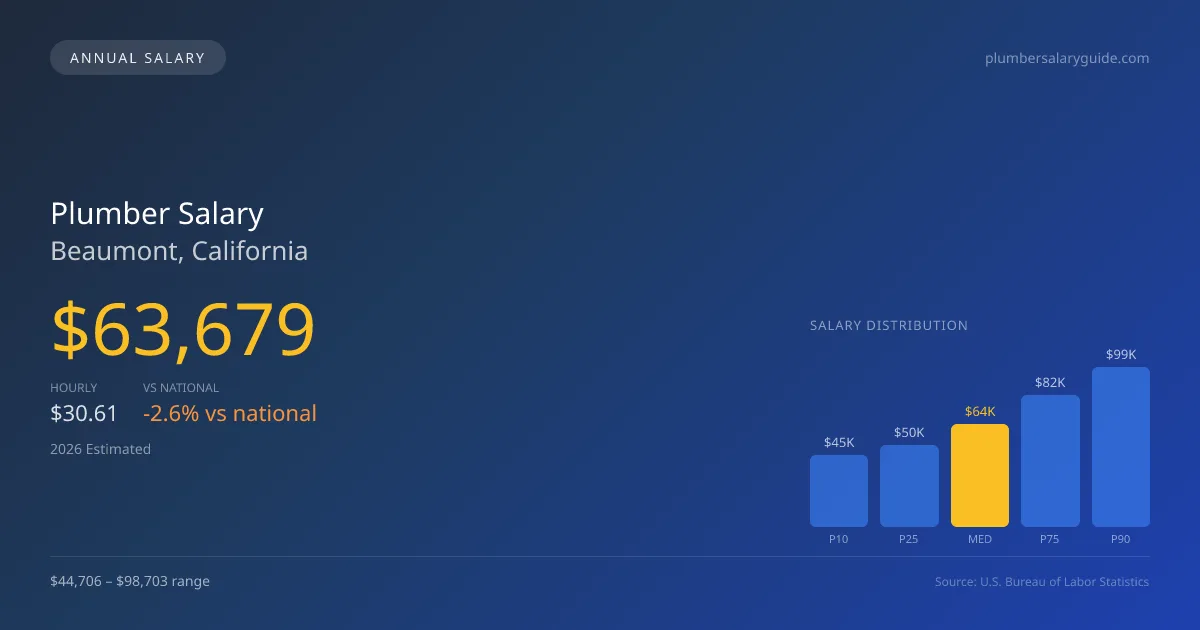
In Beaumont, California, plumbers can expect a median annual salary of $63,679 in 2026, slightly below the national average of $65,408. The salary range is quite broad, with entry-level positions earning approximately $44,706 and experienced plumbers able to earn as much as $98,703. These figures reflect the local economic climate, adjusted for cost-of-living factors, which is indexed at 113.1, indicating that living expenses are higher than the national average. This could be attributed to factors like demand for skilled tradespeople and the rising costs of materials and services. Given the local market's dynamics, reaching a specialty premium in areas such as medical gas or industrial plumbing can substantially increase earning potential, making careers in these niches particularly lucrative.
About the Beaumont Market
Salary estimated from California average ($82,000) adjusted for local cost of living.
Salary Breakdown
| Percentile | Annual | Hourly |
|---|---|---|
| Entry Level (P10) | $44,706 | $21.49 |
| Lower Range (P25) | $50,293 | $24.18 |
| Median (P50)(typical) | $63,679 | $30.61 |
| Upper Range (P75) | $81,510 | $39.18 |
| Top Earners (P90) | $98,703 | $47.46 |
Median Salary Position
2.64% below the national average
2026 Salary Percentile Distribution in Beaumont
In Beaumont, CA, the plumber salary spread from the 10th to 90th percentile is $53,997 (2026 est.). At $63,679, the local median is 2.64% below the national median of $65,408.
Salary Calculator
At 40 hours/week in Beaumont: You'd be in the lower-middle range
How Beaumont Plumber Pay Compares
Beaumont median: $63,679/year (2026)
| Compared To | Median Salary | Beaumont Pays |
|---|---|---|
| California Average | $65,514 | -2.80% less |
| National Average | $65,408 | -2.64% less |
Plumbers in Beaumont, CA earn a median of $63,679 per year (2026 est.), which is 2.64% lower than the national median of $65,408 and 2.80% below the California state average of $65,514.
Cost-of-Living Adjusted Salary
Beaumont has a cost of living 13.10% above the national average.
Adjusted salary = nominal × (100 / CoL index). CoL index: 100 = national average.
Beaumont, CA has a cost-of-living index of 113.1 (above the national average of 100). While the nominal salary of $63,679 is competitive, the higher cost of living reduces purchasing power to an effective $56,303 — a 11.58% reduction.
Compare Purchasing Power
Select a city to see how your salary compares after cost of living
Select a city above to compare purchasing power
2019 BLS Actual
$53,702
2025 BLS Actual
$62,114
2026 Current Est.
$63,679
2019–2027 Growth
+21.6%
Salary Trajectory for Plumbers in Beaumont (2019–2027)
2019–2025: actual BLS OEWS data for this metro area. 2026+: CAGR 2.52% projection.
| Year | Annual Salary | Status |
|---|---|---|
| 2019 | $53,702 | Actual |
| 2020 | $54,841 | Actual |
| 2021 | $58,298 | Actual |
| 2022 | $58,502 | Actual |
| 2023 | $59,923 | Actual |
| 2024 | $90,122 | Actual |
| 2025 | $62,114 | Actual |
| 2026(current) | $63,679 | Estimated |
| 2027 | $65,284 | Projected |
Based on 7 years of BLS OEWS data for the Beaumont metropolitan area, the median plumber salary grew 15.7% from $53,702 (2019) to $62,114 (2025). At a 2.52% compound annual growth rate, salaries are projected to reach $65,284 by 2027 — a total increase of $11,582 (21.57%) from 2019.
Note: Historical values (2019–2025) are actual BLS OEWS figures for the Beaumont metropolitan area, sourced from annual Occupational Employment and Wage Statistics surveys. 2026–2026 figures are current estimates, and 2027 values are projections, calculated using a 2.52% CAGR derived from 7-year BLS historical data. Actual salaries may vary based on employer, experience, certifications, and local market conditions.
Salary by Experience Level
| Experience | Estimated Salary Range |
|---|---|
| 0-2 years (New Graduate) | $44,706 – $50,293 |
| 3-5 years (Mid Career) | $50,293 – $63,679 |
| 5+ years (Experienced) | $63,679 – $81,510 |
| 10+ years (Top Earner) | $81,510 – $98,703 |
Plumber salary ranges estimated from BLS percentile data. Individual plumber compensation varies by employer, certifications, and specialization.
Plumber Job Market in Beaumont
Job prospects for plumbers in Beaumont are moderate, with only nine plumbers currently employed in the area. However, the elevated cost of living impacts take-home purchasing power, necessitating careful financial planning for local tradespeople. Employers offering the highest compensation include union plumbing contractors affiliated with the United Association, which often provide a 30-50% wage premium compared to non-union positions. On the other hand, service plumbing firms like Roto-Rooter, while potentially lucrative due to commission-based pay structures, present variability in income. The salary disparity is influenced by numerous factors, including the type of plumbing—specialty credentials in areas like medical gas installation or backflow prevention can command higher wages. For those looking to maximize their pay, obtaining advanced licenses, targeting high-demand specialty areas, and considering union affiliation are effective strategies in the Beaumont job market.
More salary data for Beaumont, CA:
Frequently Asked Questions
How much do plumbers make in Beaumont, CA in 2026?
Is Beaumont, CA a good place to work as a plumber?
Can plumbers make $100K in Beaumont?
What is the cost-of-living adjusted plumber salary in Beaumont?
How much does a plumber make per hour in Beaumont?
Related Pages
Compare Salaries
Career Resources
Nearby Cities in California
Written by Samuel Torres, CWP
Career Analyst
Samuel Torres has 10 years of experience in plumbing. He specializes in residential plumbing systems. He has worked with several home improvement companies.
Methodology & Data Source
Salary figures on this page are 2026 projections based on the Bureau of Labor Statistics Occupational Employment and Wage Statistics (OEWS) survey, May 2026 release. The BLS reported a median annual salary of $62,114 for plumbersin the Beaumont metropolitan area. A 2.52% compound annual growth rate (CAGR), calculated from 6-year national BLS wage trends, was applied to project current 2026 compensation. Percentile ranges (P10–P90) represent the full salary distribution across experience levels and practice settings in this market.
Data Sources & Methodology
Salary data for Beaumont is estimated from official BLS state-level occupational wage data (2025), adjusted for regional cost-of-living differences using BEA RPP (Regional Price Parities).
2026 figures are projected from 2025 BLS data using a compound annual growth rate (CAGR) of 2.52%, derived from historical BLS wage trends for plumbers (SOC 47-2152).
Compiled and verified by Samuel Torres, CWP, a licensed plumber with 10+ years of clinical experience. · View source data at BLS.gov