Plumber Salary in Pittsburg, CA: $65,891 (2026)
Quick Answer:A full-time plumber in Pittsburg, CA earns a median $65,891/year (≈ $31.68/hour) in nominal terms for 2026 — projected from BLS OEWS 2025 (SOC 47-2152). Once you factor in Pittsburg's price level (13% above national, BEA RPP 113.1), that paycheck buys what $58,259 would nationally. Nominal pay sits 0.5% above the California state average.
Based on BLS state-level estimates · View source
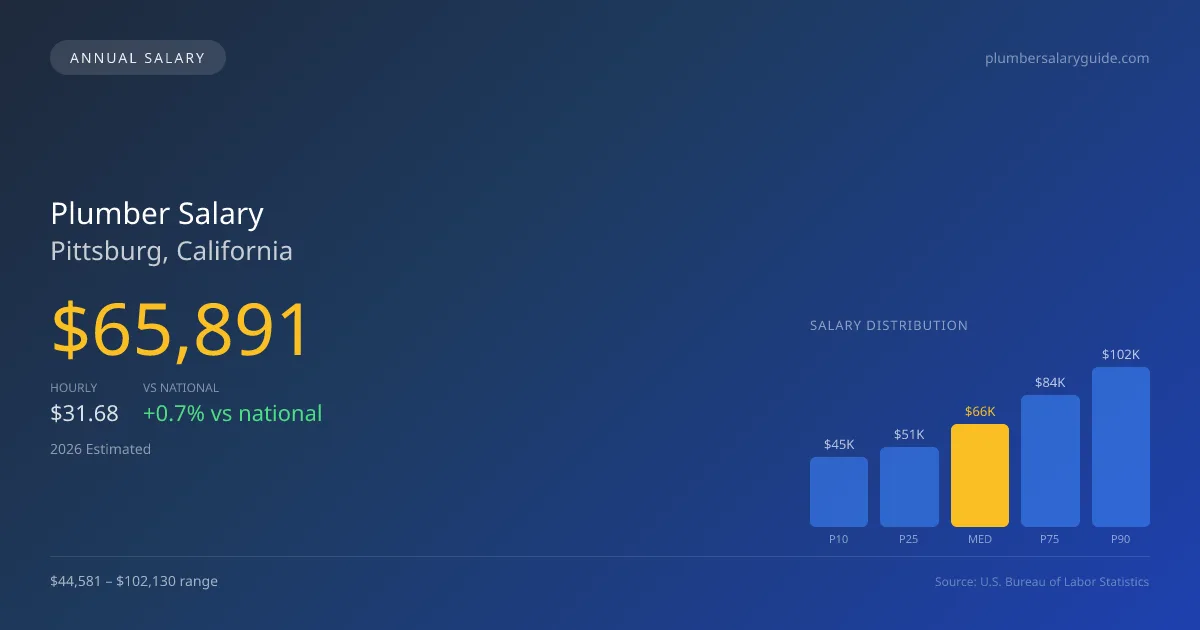
Earning a competitive $65,891 annually, plumbers in Pittsburg, California, are well-positioned compared to their national counterparts, who see a median salary of $65,408. The salary range for this profession is quite varied, spanning from $44,581 at the 10th percentile to $102,130 at the 90th percentile, reflecting not only the skill level but also the different specialties within plumbing. These figures, derived from 2025 BLS data projected to 2026, highlight the dynamics of the local market and the additional premiums available for specialized work, such as medical gas or industrial plumbing. The steady demand for these services in Pittsburg speaks to the underlying stability and growth potential within the area’s plumbing sector.
About the Pittsburg Market
Salary estimated from California average ($82,000) adjusted for local cost of living.
Salary Breakdown
| Percentile | Annual | Hourly |
|---|---|---|
| Entry Level (P10) | $44,581 | $21.44 |
| Lower Range (P25) | $50,781 | $24.41 |
| Median (P50)(typical) | $65,891 | $31.68 |
| Upper Range (P75) | $84,340 | $40.55 |
| Top Earners (P90) | $102,130 | $49.10 |
Median Salary Position
0.74% above the national average
2026 Salary Percentile Distribution in Pittsburg
In Pittsburg, CA, the plumber salary spread from the 10th to 90th percentile is $57,549 (2026 est.). At $65,891, the local median is 0.74% above the national median of $65,408.
Salary Calculator
At 40 hours/week in Pittsburg: You'd be in the lower-middle range
How Pittsburg Plumber Pay Compares
Pittsburg median: $65,891/year (2026)
| Compared To | Median Salary | Pittsburg Pays |
|---|---|---|
| California Average | $65,563 | +0.50% more |
| National Average | $65,408 | +0.74% more |
Plumbers in Pittsburg, CA earn a median of $65,891 per year (2026 est.), which is 0.74% higher than the national median of $65,408 and 0.50% above the California state average of $65,563.
Cost-of-Living Adjusted Salary
Pittsburg has a cost of living 13.10% above the national average.
Adjusted salary = nominal × (100 / CoL index). CoL index: 100 = national average.
Pittsburg, CA has a cost-of-living index of 113.1 (above the national average of 100). While the nominal salary of $65,891 is competitive, the higher cost of living reduces purchasing power to an effective $58,259 — a 11.58% reduction.
Compare Purchasing Power
Select a city to see how your salary compares after cost of living
Select a city above to compare purchasing power
2019 BLS Actual
$55,567
2025 BLS Actual
$64,271
2026 Current Est.
$65,891
2019–2027 Growth
+21.6%
Salary Trajectory for Plumbers in Pittsburg (2019–2027)
2019–2025: actual BLS OEWS data for this metro area. 2026+: CAGR 2.52% projection.
| Year | Annual Salary | Status |
|---|---|---|
| 2019 | $55,567 | Actual |
| 2020 | $56,746 | Actual |
| 2021 | $60,322 | Actual |
| 2022 | $60,534 | Actual |
| 2023 | $62,004 | Actual |
| 2024 | $93,251 | Actual |
| 2025 | $64,271 | Actual |
| 2026(current) | $65,891 | Estimated |
| 2027 | $67,551 | Projected |
Based on 7 years of BLS OEWS data for the Pittsburg metropolitan area, the median plumber salary grew 15.7% from $55,567 (2019) to $64,271 (2025). At a 2.52% compound annual growth rate, salaries are projected to reach $67,551 by 2027 — a total increase of $11,984 (21.57%) from 2019.
Note: Historical values (2019–2025) are actual BLS OEWS figures for the Pittsburg metropolitan area, sourced from annual Occupational Employment and Wage Statistics surveys. 2026–2026 figures are current estimates, and 2027 values are projections, calculated using a 2.52% CAGR derived from 7-year BLS historical data. Actual salaries may vary based on employer, experience, certifications, and local market conditions.
Salary by Experience Level
| Experience | Estimated Salary Range |
|---|---|
| 0-2 years (New Graduate) | $44,581 – $50,781 |
| 3-5 years (Mid Career) | $50,781 – $65,891 |
| 5+ years (Experienced) | $65,891 – $84,340 |
| 10+ years (Top Earner) | $84,340 – $102,130 |
Plumber salary ranges estimated from BLS percentile data. Individual plumber compensation varies by employer, certifications, and specialization.
Plumber Job Market in Pittsburg
With only 19 plumbers employed locally, the Pittsburg job market presents unique opportunities and challenges. The cost of living index in the area stands at 113.1, signaling a higher-than-average cost of living that can significantly affect take-home pay and purchasing power. Those aiming for higher earnings should focus on skill sets most valued by employers, particularly in unionized environments where UA signatories often pay premiums compared to non-union shops. Additionally, specializing in areas such as medical gas or obtaining master contractor licenses can lead to higher income, as can positions that offer overtime or commission pay structures, common in service companies like Roto-Rooter and ARS. Understanding these market dynamics empowers plumbers in Pittsburg, CA, to make informed career decisions and maximize their earning potential.
More salary data for Pittsburg, CA:
Frequently Asked Questions
How much do plumbers make in Pittsburg, CA in 2026?
Is Pittsburg, CA a good place to work as a plumber?
Can plumbers make $100K in Pittsburg?
What is the cost-of-living adjusted plumber salary in Pittsburg?
How much does a plumber make per hour in Pittsburg?
Related Pages
Compare Salaries
Career Resources
Nearby Cities in California
Written by Samuel Torres, CWP
Career Analyst
Samuel Torres has 10 years of experience in plumbing. He specializes in residential plumbing systems. He has worked with several home improvement companies.
Methodology & Data Source
Salary figures on this page are 2026 projections based on the Bureau of Labor Statistics Occupational Employment and Wage Statistics (OEWS) survey, May 2026 release. The BLS reported a median annual salary of $64,271 for plumbersin the Pittsburg metropolitan area. A 2.52% compound annual growth rate (CAGR), calculated from 6-year national BLS wage trends, was applied to project current 2026 compensation. Percentile ranges (P10–P90) represent the full salary distribution across experience levels and practice settings in this market.
Data Sources & Methodology
Salary data for Pittsburg is estimated from official BLS state-level occupational wage data (2025), adjusted for regional cost-of-living differences using BEA RPP (Regional Price Parities).
2026 figures are projected from 2025 BLS data using a compound annual growth rate (CAGR) of 2.52%, derived from historical BLS wage trends for plumbers (SOC 47-2152).
Compiled and verified by Samuel Torres, CWP, a licensed plumber with 10+ years of clinical experience. · View source data at BLS.gov