Plumber Salary in San Leandro, CA: $64,411 (2026)
Quick Answer:A full-time plumber in San Leandro, CA earns a median $64,411/year (≈ $30.97/hour) in nominal terms for 2026 — projected from BLS OEWS 2025 (SOC 47-2152). Once you factor in San Leandro's price level (13% above national, BEA RPP 113.1), that paycheck buys what $56,950 would nationally. Nominal pay sits 1.7% below the California state average.
Based on BLS state-level estimates · View source
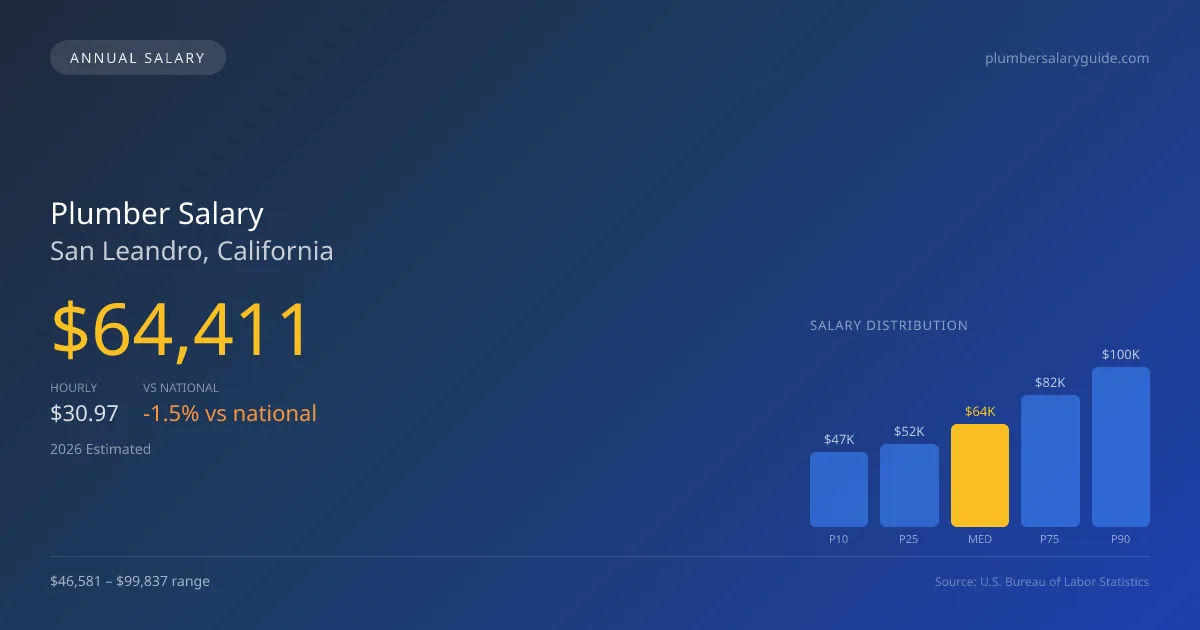
In 2026, the projected plumber salary in San Leandro stands at $64,411, slightly below the national median of $65,408. The salary range varies significantly, from $46,581 at the low end to a notable $99,837 at the high end, reflecting the diverse qualifications and specialties within the field. These estimates, derived from 2025 BLS Occupational Employment and Wage Statistics data, indicate a vibrant job market for plumbers in the area, where specialized skills such as medical gas installations or industrial plumbing can command premiums. As San Leandro continues to develop, the demand for skilled plumbers ensures competitive compensation and opportunities for career advancement.
About the San Leandro Market
Salary estimated from California average ($82,000) adjusted for local cost of living.
Salary Breakdown
| Percentile | Annual | Hourly |
|---|---|---|
| Entry Level (P10) | $46,581 | $22.39 |
| Lower Range (P25) | $51,744 | $24.88 |
| Median (P50)(typical) | $64,411 | $30.97 |
| Upper Range (P75) | $82,447 | $39.63 |
| Top Earners (P90) | $99,837 | $48.00 |
Median Salary Position
1.52% below the national average
2026 Salary Percentile Distribution in San Leandro
In San Leandro, CA, the plumber salary spread from the 10th to 90th percentile is $53,256 (2026 est.). At $64,411, the local median is 1.52% below the national median of $65,408.
Salary Calculator
At 40 hours/week in San Leandro: You'd be in the lower-middle range
How San Leandro Plumber Pay Compares
San Leandro median: $64,411/year (2026)
| Compared To | Median Salary | San Leandro Pays |
|---|---|---|
| California Average | $65,525 | -1.70% less |
| National Average | $65,408 | -1.52% less |
Plumbers in San Leandro, CA earn a median of $64,411 per year (2026 est.), which is 1.52% lower than the national median of $65,408 and 1.70% below the California state average of $65,525.
Cost-of-Living Adjusted Salary
San Leandro has a cost of living 13.10% above the national average.
Adjusted salary = nominal × (100 / CoL index). CoL index: 100 = national average.
San Leandro, CA has a cost-of-living index of 113.1 (above the national average of 100). While the nominal salary of $64,411 is competitive, the higher cost of living reduces purchasing power to an effective $56,950 — a 11.58% reduction.
Compare Purchasing Power
Select a city to see how your salary compares after cost of living
Select a city above to compare purchasing power
2019 BLS Actual
$54,320
2025 BLS Actual
$62,828
2026 Current Est.
$64,411
2019–2027 Growth
+21.6%
Salary Trajectory for Plumbers in San Leandro (2019–2027)
2019–2025: actual BLS OEWS data for this metro area. 2026+: CAGR 2.52% projection.
| Year | Annual Salary | Status |
|---|---|---|
| 2019 | $54,320 | Actual |
| 2020 | $55,472 | Actual |
| 2021 | $58,968 | Actual |
| 2022 | $59,175 | Actual |
| 2023 | $60,612 | Actual |
| 2024 | $91,157 | Actual |
| 2025 | $62,828 | Actual |
| 2026(current) | $64,411 | Estimated |
| 2027 | $66,034 | Projected |
Based on 7 years of BLS OEWS data for the San Leandro metropolitan area, the median plumber salary grew 15.7% from $54,320 (2019) to $62,828 (2025). At a 2.52% compound annual growth rate, salaries are projected to reach $66,034 by 2027 — a total increase of $11,714 (21.56%) from 2019.
Note: Historical values (2019–2025) are actual BLS OEWS figures for the San Leandro metropolitan area, sourced from annual Occupational Employment and Wage Statistics surveys. 2026–2026 figures are current estimates, and 2027 values are projections, calculated using a 2.52% CAGR derived from 7-year BLS historical data. Actual salaries may vary based on employer, experience, certifications, and local market conditions.
Salary by Experience Level
| Experience | Estimated Salary Range |
|---|---|
| 0-2 years (New Graduate) | $46,581 – $51,744 |
| 3-5 years (Mid Career) | $51,744 – $64,411 |
| 5+ years (Experienced) | $64,411 – $82,447 |
| 10+ years (Top Earner) | $82,447 – $99,837 |
Plumber salary ranges estimated from BLS percentile data. Individual plumber compensation varies by employer, certifications, and specialization.
Plumber Job Market in San Leandro
Although only 23 plumbers are currently employed in San Leandro, the local job market's strengths lie in its varied compensation structures. The cost-of-living index is 113.1, reflecting higher housing and everyday expenses compared to the national average, which can impact take-home pay. Employers range from union plumbing contractors, offering a premium over non-union wages, to large service companies like Roto-Rooter and ARS, which often employ commission-based structures. Those plumbing professionals with niche specialties—such as medical gas or industrial piping—tend to see higher wages. Strategies for maximizing plumber pay in this market include obtaining a master plumber’s license, pursuing specialty certifications, and considering employment with unionized contractors or larger firms that offer overtime and benefits.
More salary data for San Leandro, CA:
Frequently Asked Questions
How much do plumbers make in San Leandro, CA in 2026?
Is San Leandro, CA a good place to work as a plumber?
Can plumbers make $100K in San Leandro?
What is the cost-of-living adjusted plumber salary in San Leandro?
How much does a plumber make per hour in San Leandro?
Related Pages
Compare Salaries
Career Resources
Nearby Cities in California
Written by Samuel Torres, CWP
Career Analyst
Samuel Torres has 10 years of experience in plumbing. He specializes in residential plumbing systems. He has worked with several home improvement companies.
Methodology & Data Source
Salary figures on this page are 2026 projections based on the Bureau of Labor Statistics Occupational Employment and Wage Statistics (OEWS) survey, May 2026 release. The BLS reported a median annual salary of $62,828 for plumbersin the San Leandro metropolitan area. A 2.52% compound annual growth rate (CAGR), calculated from 6-year national BLS wage trends, was applied to project current 2026 compensation. Percentile ranges (P10–P90) represent the full salary distribution across experience levels and practice settings in this market.
Data Sources & Methodology
Salary data for San Leandro is estimated from official BLS state-level occupational wage data (2025), adjusted for regional cost-of-living differences using BEA RPP (Regional Price Parities).
2026 figures are projected from 2025 BLS data using a compound annual growth rate (CAGR) of 2.52%, derived from historical BLS wage trends for plumbers (SOC 47-2152).
Compiled and verified by Samuel Torres, CWP, a licensed plumber with 10+ years of clinical experience. · View source data at BLS.gov