Plumber Salary in Norwich, CT: $78,920 (2026)
Quick Answer:A full-time plumber in Norwich, CT earns a median $78,920/year (≈ $37.94/hour) in nominal terms for 2026 — projected from BLS OEWS 2025 (SOC 47-2152). Once you factor in Norwich's price level (0% above national, BEA RPP 100.4), that paycheck buys what $78,570 would nationally. Nominal pay sits 0.3% below the Connecticut state average.
Official BLS data · View source
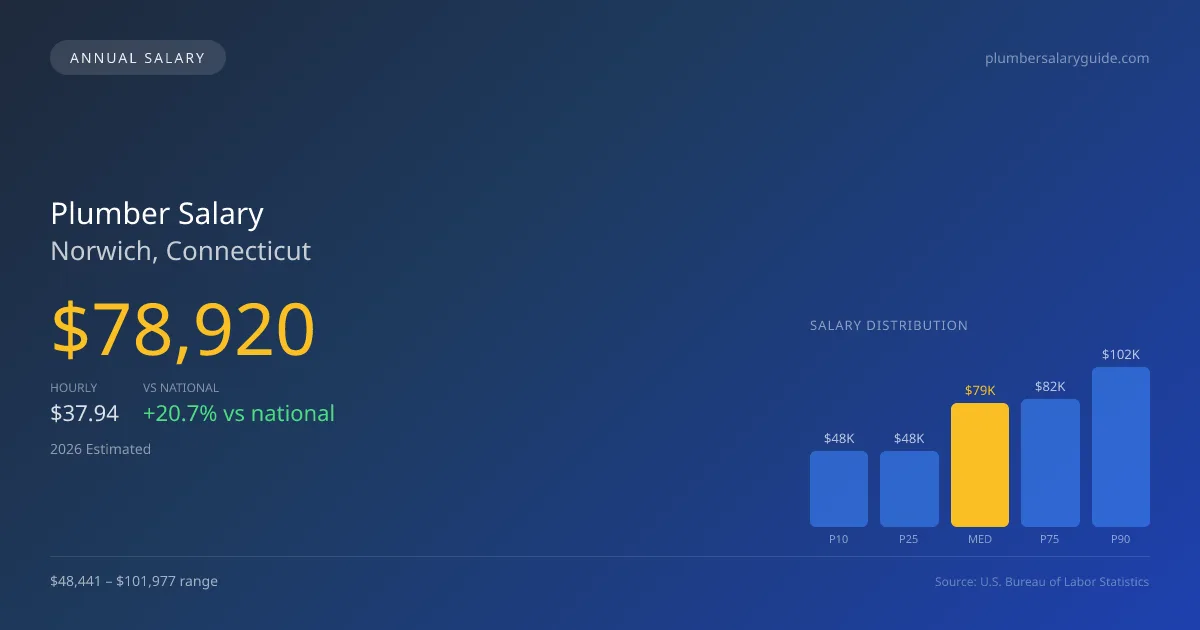
With a median annual salary of $78,920 projected for 2026, plumbing professionals in Norwich, CT, enjoy compensation that surpasses the national average by 20.66%. The salary range extends from $48,441 at the lower end (10th percentile) to $101,977 at the upper end (90th percentile), reflecting a diverse job market shaped heavily by the influence of union membership. Official Bureau of Labor Statistics (BLS) OEWS data highlights the difference between UA union pipefitters and non-union service plumbers, with unions typically offering a pay premium of 30-50%. This dynamic contributes to a competitive edge for unionized roles, as the labor market in Norwich sees a blend of both union and non-union positions, allowing for various earning potentials within the profession.
Salary Breakdown
| Percentile | Annual | Hourly |
|---|---|---|
| Entry Level (P10) | $48,441 | $23.29 |
| Lower Range (P25) | $48,441 | $23.29 |
| Median (P50)(typical) | $78,920 | $37.94 |
| Upper Range (P75) | $81,606 | $39.23 |
| Top Earners (P90) | $101,977 | $49.03 |
Median Salary Position
20.66% above the national average
2026 Salary Percentile Distribution in Norwich
In Norwich, CT, the plumber salary spread from the 10th to 90th percentile is $53,536 (2026 est.). At $78,920, the local median is 20.66% above the national median of $65,408.
Salary Calculator
At 40 hours/week in Norwich: You'd be above the median
How Norwich Plumber Pay Compares
Norwich median: $78,920/year (2026)
| Compared To | Median Salary | Norwich Pays |
|---|---|---|
| Connecticut Average | $79,157 | -0.30% less |
| National Average | $65,408 | +20.66% more |
Plumbers in Norwich, CT earn a median of $78,920 per year (2026 est.), which is 20.66% higher than the national median of $65,408 and 0.30% below the Connecticut state average of $79,157.
Cost-of-Living Adjusted Salary
Norwich has a cost of living 0.44% above the national average.
Adjusted salary = nominal × (100 / CoL index). CoL index: 100 = national average.
Norwich, CT has a cost-of-living index of 100.445 (above the national average of 100). While the nominal salary of $78,920 is competitive, the higher cost of living reduces purchasing power to an effective $78,570 — a 0.44% reduction.
Compare Purchasing Power
Select a city to see how your salary compares after cost of living
Select a city above to compare purchasing power
2019 BLS Actual
$57,210
2025 BLS Actual
$76,980
2026 Current Est.
$78,920
2019–2027 Growth
+41.4%
Salary Trajectory for Plumbers in Norwich (2019–2027)
2019–2025: actual BLS OEWS data for this metro area. 2026+: CAGR 2.52% projection.
| Year | Annual Salary | Status |
|---|---|---|
| 2019 | $57,210 | Actual |
| 2020 | $62,020 | Actual |
| 2021 | $62,210 | Actual |
| 2022 | $69,120 | Actual |
| 2023 | $60,300 | Actual |
| 2024 | $65,880 | Actual |
| 2025 | $76,980 | Actual |
| 2026(current) | $78,920 | Estimated |
| 2027 | $80,909 | Projected |
Based on 7 years of BLS OEWS data for the Norwich metropolitan area, the median plumber salary grew 34.6% from $57,210 (2019) to $76,980 (2025). At a 2.52% compound annual growth rate, salaries are projected to reach $80,909 by 2027 — a total increase of $23,699 (41.42%) from 2019.
Note: Historical values (2019–2025) are actual BLS OEWS figures for the Norwich metropolitan area, sourced from annual Occupational Employment and Wage Statistics surveys. 2026–2026 figures are current estimates, and 2027 values are projections, calculated using a 2.52% CAGR derived from 7-year BLS historical data. Actual salaries may vary based on employer, experience, certifications, and local market conditions.
Salary by Experience Level
| Experience | Estimated Salary Range |
|---|---|
| 0-2 years (New Graduate) | $48,441 – $48,441 |
| 3-5 years (Mid Career) | $48,441 – $78,920 |
| 5+ years (Experienced) | $78,920 – $81,606 |
| 10+ years (Top Earner) | $81,606 – $101,977 |
Plumber salary ranges estimated from BLS percentile data. Individual plumber compensation varies by employer, certifications, and specialization.
Plumber Job Market in Norwich
In Norwich, approximately 870 plumbers are employed, contributing to a robust job market characterized by a cost-of-living index of 100.445, which slightly exceeds the national average. This figure indicates that while salaries are relatively higher, the cost of living also impacts overall purchasing power. Among local employers, those associated with the UA typically provide the highest wages, particularly in specialties such as medical gas and industrial pipefitting, which command premium rates due to their complexity. The disparity in pay is also influenced by factors such as the master and contractor licenses, commission structures in residential service roles, and opportunities for overtime in industrial maintenance teams. To maximize earnings, aspiring plumbers should seek out union apprenticeship programs, specialized certifications, and consider positions with service companies that often offer additional commission-based revenue, giving them an advantage in the local market.
More salary data for Norwich, CT:
Frequently Asked Questions
How much do plumbers make in Norwich, CT in 2026?
Is Norwich, CT a good place to work as a plumber?
Can plumbers make $100K in Norwich?
What is the cost-of-living adjusted plumber salary in Norwich?
How much does a plumber make per hour in Norwich?
Related Pages
Compare Salaries
Career Resources
Nearby Cities in Connecticut
Written by Samuel Torres, CWP
Career Analyst
Samuel Torres has 10 years of experience in plumbing. He specializes in residential plumbing systems. He has worked with several home improvement companies.
Methodology & Data Source
Salary figures on this page are 2026 projections based on the Bureau of Labor Statistics Occupational Employment and Wage Statistics (OEWS) survey, May 2026 release. The BLS reported a median annual salary of $76,980 for plumbersin the Norwich metropolitan area. A 2.52% compound annual growth rate (CAGR), calculated from 6-year national BLS wage trends, was applied to project current 2026 compensation. Percentile ranges (P10–P90) represent the full salary distribution across experience levels and practice settings in this market.
Data Sources & Methodology
Source: BLS, OEWS, 7-year dataset (–). Per-city data from annual BLS metropolitan area surveys.
2026 figures are projected from 2025 BLS data using a compound annual growth rate (CAGR) of 2.52%, derived from historical BLS wage trends for plumbers (SOC 47-2152).
Compiled and verified by Samuel Torres, CWP, a licensed plumber with 10+ years of clinical experience. · View source data at BLS.gov