Plumber Salary in Tampa, FL: $53,310 (2026)
Quick Answer:A full-time plumber in Tampa, FL earns a median $53,310/year (≈ $25.63/hour) in nominal terms for 2026 — projected from BLS OEWS 2025 (SOC 47-2152). Once you factor in Tampa's price level (1% above national, BEA RPP 100.9), that paycheck buys what $52,840 would nationally. Nominal pay sits 0.7% above the Florida state average.
Official BLS data · View source
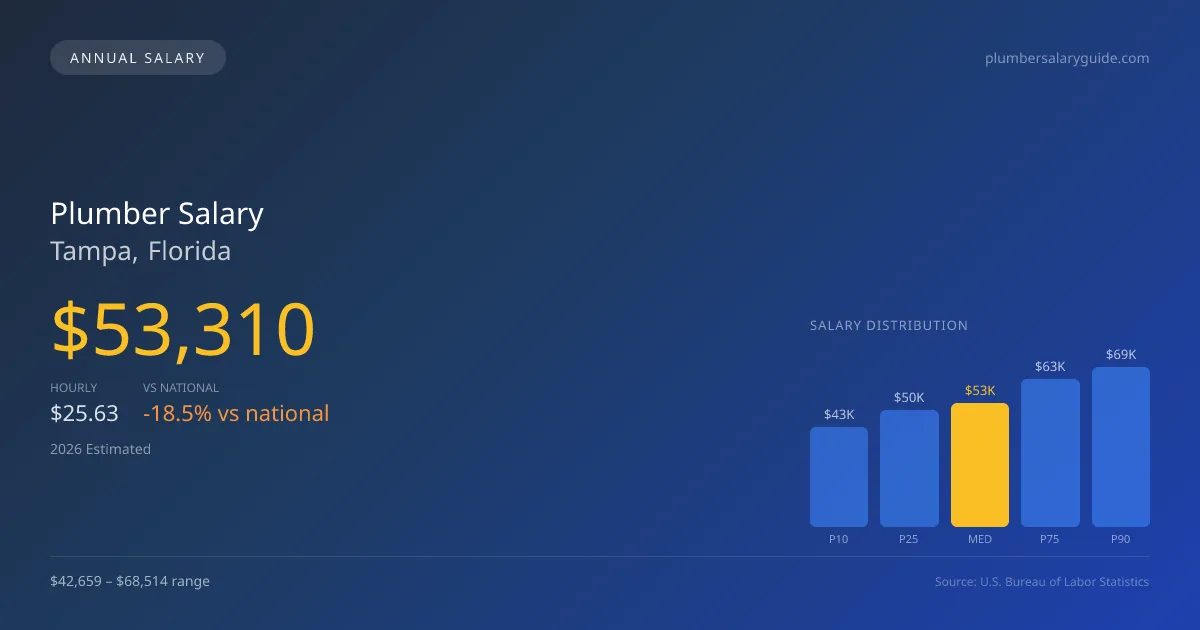
Plumbers in Tampa, FL, can anticipate a median annual salary of $53,310 in 2026, reflecting a significant difference compared to the national figure of $65,408. The salary range for plumbers in this city is broad, from $42,659 at the low end (P10) to $68,514 for the top earners (P90). This data, derived from the 2025 BLS OEWS surveys and projected to 2026, highlights the potential for skilled plumbers, particularly those with specialization in areas such as medical gas or industrial piping, which can offer a notable premium. The demand for qualified professionals in Tampa remains strong, contributing to positive growth in this sector.
Salary Breakdown
| Percentile | Annual | Hourly |
|---|---|---|
| Entry Level (P10) | $42,659 | $20.50 |
| Lower Range (P25) | $49,968 | $24.02 |
| Median (P50)(typical) | $53,310 | $25.63 |
| Upper Range (P75) | $63,275 | $30.42 |
| Top Earners (P90) | $68,514 | $32.94 |
Median Salary Position
18.5% below the national average
2026 Salary Percentile Distribution in Tampa
In Tampa, FL, the plumber salary spread from the 10th to 90th percentile is $25,855 (2026 est.). At $53,310, the local median is 18.5% below the national median of $65,408.
Salary Calculator
At 40 hours/week in Tampa: You'd be in the lower-middle range
How Tampa Plumber Pay Compares
Tampa median: $53,310/year (2026)
| Compared To | Median Salary | Tampa Pays |
|---|---|---|
| Florida Average | $52,940 | +0.70% more |
| National Average | $65,408 | -18.50% less |
Plumbers in Tampa, FL earn a median of $53,310 per year (2026 est.), which is 18.50% lower than the national median of $65,408 and 0.70% above the Florida state average of $52,940.
Cost-of-Living Adjusted Salary
Tampa has a cost of living 0.89% above the national average.
Adjusted salary = nominal × (100 / CoL index). CoL index: 100 = national average.
Tampa, FL has a cost-of-living index of 100.89 (above the national average of 100). While the nominal salary of $53,310 is competitive, the higher cost of living reduces purchasing power to an effective $52,840 — a 0.88% reduction.
Compare Purchasing Power
Select a city to see how your salary compares after cost of living
Select a city above to compare purchasing power
2019 BLS Actual
$44,330
2025 BLS Actual
$52,000
2026 Current Est.
$53,310
2019–2027 Growth
+23.3%
Salary Trajectory for Plumbers in Tampa (2019–2027)
2019–2025: actual BLS OEWS data for this metro area. 2026+: CAGR 2.52% projection.
| Year | Annual Salary | Status |
|---|---|---|
| 2019 | $44,330 | Actual |
| 2020 | $43,450 | Actual |
| 2021 | $48,000 | Actual |
| 2022 | $47,630 | Actual |
| 2023 | $49,350 | Actual |
| 2024 | $52,280 | Actual |
| 2025 | $52,000 | Actual |
| 2026(current) | $53,310 | Estimated |
| 2027 | $54,654 | Projected |
Based on 7 years of BLS OEWS data for the Tampa metropolitan area, the median plumber salary grew 17.3% from $44,330 (2019) to $52,000 (2025). At a 2.52% compound annual growth rate, salaries are projected to reach $54,654 by 2027 — a total increase of $10,324 (23.29%) from 2019.
Note: Historical values (2019–2025) are actual BLS OEWS figures for the Tampa metropolitan area, sourced from annual Occupational Employment and Wage Statistics surveys. 2026–2026 figures are current estimates, and 2027 values are projections, calculated using a 2.52% CAGR derived from 7-year BLS historical data. Actual salaries may vary based on employer, experience, certifications, and local market conditions.
Salary by Experience Level
| Experience | Estimated Salary Range |
|---|---|
| 0-2 years (New Graduate) | $42,659 – $49,968 |
| 3-5 years (Mid Career) | $49,968 – $53,310 |
| 5+ years (Experienced) | $53,310 – $63,275 |
| 10+ years (Top Earner) | $63,275 – $68,514 |
Plumber salary ranges estimated from BLS percentile data. Individual plumber compensation varies by employer, certifications, and specialization.
Plumber Job Market in Tampa
With about 4,180 plumbers employed in the Tampa area, the local job market offers a variety of opportunities, though the cost of living index stands slightly above average at 100.89. This situation can influence take-home purchasing power, especially for those in entry-level positions. Employers such as union plumbing contractors generally provide higher pay rates compared to non-union or open-shop contractors, where the differences can be pronounced due to varying pay scales and commissioning structures. Factors like specialty certifications—such as medical gas accreditation—and the distinction between service plumbing and industrial maintenance can further drive disparities in wages. For those looking to maximize their earning potential, acquiring additional credentials, pursuing union membership, or diversifying skills across different plumbing sectors may enhance overall compensation.
More salary data for Tampa, FL:
Frequently Asked Questions
How much do plumbers make in Tampa, FL in 2026?
Is Tampa, FL a good place to work as a plumber?
Can plumbers make $100K in Tampa?
What is the cost-of-living adjusted plumber salary in Tampa?
How much does a plumber make per hour in Tampa?
Related Pages
Compare Salaries
Career Resources
Nearby Cities in Florida
Written by Samuel Torres, CWP
Career Analyst
Samuel Torres has 10 years of experience in plumbing. He specializes in residential plumbing systems. He has worked with several home improvement companies.
Methodology & Data Source
Salary figures on this page are 2026 projections based on the Bureau of Labor Statistics Occupational Employment and Wage Statistics (OEWS) survey, May 2026 release. The BLS reported a median annual salary of $52,000 for plumbersin the Tampa metropolitan area. A 2.52% compound annual growth rate (CAGR), calculated from 6-year national BLS wage trends, was applied to project current 2026 compensation. Percentile ranges (P10–P90) represent the full salary distribution across experience levels and practice settings in this market.
Data Sources & Methodology
Source: BLS, OEWS, 7-year dataset (–). Per-city data from annual BLS metropolitan area surveys.
2026 figures are projected from 2025 BLS data using a compound annual growth rate (CAGR) of 2.52%, derived from historical BLS wage trends for plumbers (SOC 47-2152).
Compiled and verified by Samuel Torres, CWP, a licensed plumber with 10+ years of clinical experience. · View source data at BLS.gov