Plumber Salary in Belleville, IL: $87,675 (2026)
Quick Answer:A full-time plumber in Belleville, IL earns a median $87,675/year (≈ $42.16/hour) in nominal terms for 2026 — projected from BLS OEWS 2025 (SOC 47-2152). Once you factor in Belleville's price level (3% below national, BEA RPP 97.1), that paycheck buys what $90,294 would nationally. Nominal pay sits 4.6% below the Illinois state average.
Based on BLS state-level estimates · View source
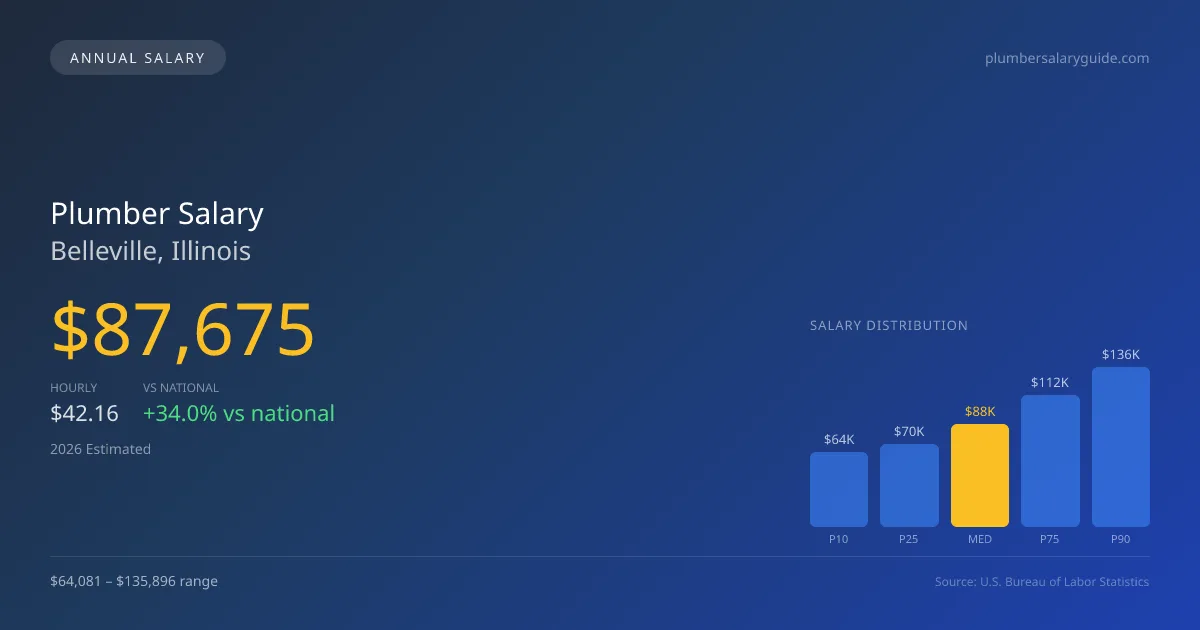
In 2026, plumbers in Belleville, Illinois are projected to earn a median annual salary of $87,675, which significantly exceeds the national median for this occupation of $65,408 by over a third. The local salary range shows considerable variance, with the lowest 10% earning around $64,081 while the top 10% can command as much as $135,896. These figures, drawn from estimates based on 2025 BLS data and adjusted for regional cost factors, highlight the specialized skills that flourish in Belleville's job market, particularly in medical gas and industrial plumbing sectors where technicians can earn a premium. As the workforce ages and infrastructure demands grow, opportunities for skilled plumbers in this area seem promising.
About the Belleville Market
Salary estimated from Illinois average ($90,000) adjusted for local cost of living.
Salary Breakdown
| Percentile | Annual | Hourly |
|---|---|---|
| Entry Level (P10) | $64,081 | $30.81 |
| Lower Range (P25) | $70,496 | $33.89 |
| Median (P50)(typical) | $87,675 | $42.16 |
| Upper Range (P75) | $112,225 | $53.96 |
| Top Earners (P90) | $135,896 | $65.34 |
Median Salary Position
34.04% above the national average
2026 Salary Percentile Distribution in Belleville
In Belleville, IL, the plumber salary spread from the 10th to 90th percentile is $71,815 (2026 est.). At $87,675, the local median is 34.04% above the national median of $65,408.
Salary Calculator
At 40 hours/week in Belleville: You'd be in the lower-middle range
How Belleville Plumber Pay Compares
Belleville median: $87,675/year (2026)
| Compared To | Median Salary | Belleville Pays |
|---|---|---|
| Illinois Average | $91,903 | -4.60% less |
| National Average | $65,408 | +34.04% more |
Plumbers in Belleville, IL earn a median of $87,675 per year (2026 est.), which is 34.04% higher than the national median of $65,408 and 4.60% below the Illinois state average of $91,903.
Cost-of-Living Adjusted Salary
Belleville has a cost of living 2.90% below the national average, meaning your salary goes further here.
Adjusted salary = nominal × (100 / CoL index). CoL index: 100 = national average.
Belleville, IL has a cost-of-living index of 97.1 (below the national average of 100). A plumber earning $87,675 nominally has purchasing power equivalent to $90,294 in an average-cost city — an effective 2.99% boost.
Compare Purchasing Power
Select a city to see how your salary compares after cost of living
Select a city above to compare purchasing power
2019 BLS Actual
$73,939
2025 BLS Actual
$85,520
2026 Current Est.
$87,675
2019–2027 Growth
+21.6%
Salary Trajectory for Plumbers in Belleville (2019–2027)
2019–2025: actual BLS OEWS data for this metro area. 2026+: CAGR 2.52% projection.
| Year | Annual Salary | Status |
|---|---|---|
| 2019 | $73,939 | Actual |
| 2020 | $75,507 | Actual |
| 2021 | $80,265 | Actual |
| 2022 | $80,547 | Actual |
| 2023 | $82,504 | Actual |
| 2024 | $83,354 | Actual |
| 2025 | $85,520 | Actual |
| 2026(current) | $87,675 | Estimated |
| 2027 | $89,885 | Projected |
Based on 7 years of BLS OEWS data for the Belleville metropolitan area, the median plumber salary grew 15.7% from $73,939 (2019) to $85,520 (2025). At a 2.52% compound annual growth rate, salaries are projected to reach $89,885 by 2027 — a total increase of $15,946 (21.57%) from 2019.
Note: Historical values (2019–2025) are actual BLS OEWS figures for the Belleville metropolitan area, sourced from annual Occupational Employment and Wage Statistics surveys. 2026–2026 figures are current estimates, and 2027 values are projections, calculated using a 2.52% CAGR derived from 7-year BLS historical data. Actual salaries may vary based on employer, experience, certifications, and local market conditions.
Salary by Experience Level
| Experience | Estimated Salary Range |
|---|---|
| 0-2 years (New Graduate) | $64,081 – $70,496 |
| 3-5 years (Mid Career) | $70,496 – $87,675 |
| 5+ years (Experienced) | $87,675 – $112,225 |
| 10+ years (Top Earner) | $112,225 – $135,896 |
Plumber salary ranges estimated from BLS percentile data. Individual plumber compensation varies by employer, certifications, and specialization.
Plumber Job Market in Belleville
The job market for plumbers in Belleville is relatively small but stable, with only 10 professionals currently employed in the area. The cost of living index stands at 97.1, suggesting that while salaries may be higher than average, the purchasing power remains manageable. Employers that tend to offer the best pay include union plumbing contractors, who often provide better compensation than their non-union counterparts. The disparity in wages can be attributed to differences in job specialization, such as medical gas or underground utility work, which often pays more than residential service. Additionally, those with master or contractor licenses have more flexibility in pricing and could maximize their income through self-employment or subcontracting. Understanding these factors and pursuing ongoing training in high-demand specialties will be crucial for plumbers looking to increase their earnings in Belleville, IL.
More salary data for Belleville, IL:
Frequently Asked Questions
How much do plumbers make in Belleville, IL in 2026?
Is Belleville, IL a good place to work as a plumber?
Can plumbers make $100K in Belleville?
What is the cost-of-living adjusted plumber salary in Belleville?
How much does a plumber make per hour in Belleville?
Related Pages
Compare Salaries
Career Resources
Nearby Cities in Illinois
Written by Samuel Torres, CWP
Career Analyst
Samuel Torres has 10 years of experience in plumbing. He specializes in residential plumbing systems. He has worked with several home improvement companies.
Methodology & Data Source
Salary figures on this page are 2026 projections based on the Bureau of Labor Statistics Occupational Employment and Wage Statistics (OEWS) survey, May 2026 release. The BLS reported a median annual salary of $85,520 for plumbersin the Belleville metropolitan area. A 2.52% compound annual growth rate (CAGR), calculated from 6-year national BLS wage trends, was applied to project current 2026 compensation. Percentile ranges (P10–P90) represent the full salary distribution across experience levels and practice settings in this market.
Data Sources & Methodology
Salary data for Belleville is estimated from official BLS state-level occupational wage data (2025), adjusted for regional cost-of-living differences using BEA RPP (Regional Price Parities).
2026 figures are projected from 2025 BLS data using a compound annual growth rate (CAGR) of 2.52%, derived from historical BLS wage trends for plumbers (SOC 47-2152).
Compiled and verified by Samuel Torres, CWP, a licensed plumber with 10+ years of clinical experience. · View source data at BLS.gov