Plumber Salary in Champaign, IL: $97,937 (2026)
Quick Answer:A full-time plumber in Champaign, IL earns a median $97,937/year (≈ $47.09/hour) in nominal terms for 2026 — projected from BLS OEWS 2025 (SOC 47-2152). Once you factor in Champaign's price level (7% below national, BEA RPP 92.7), that paycheck buys what $105,645 would nationally. Nominal pay sits 6.5% above the Illinois state average.
Official BLS data · View source
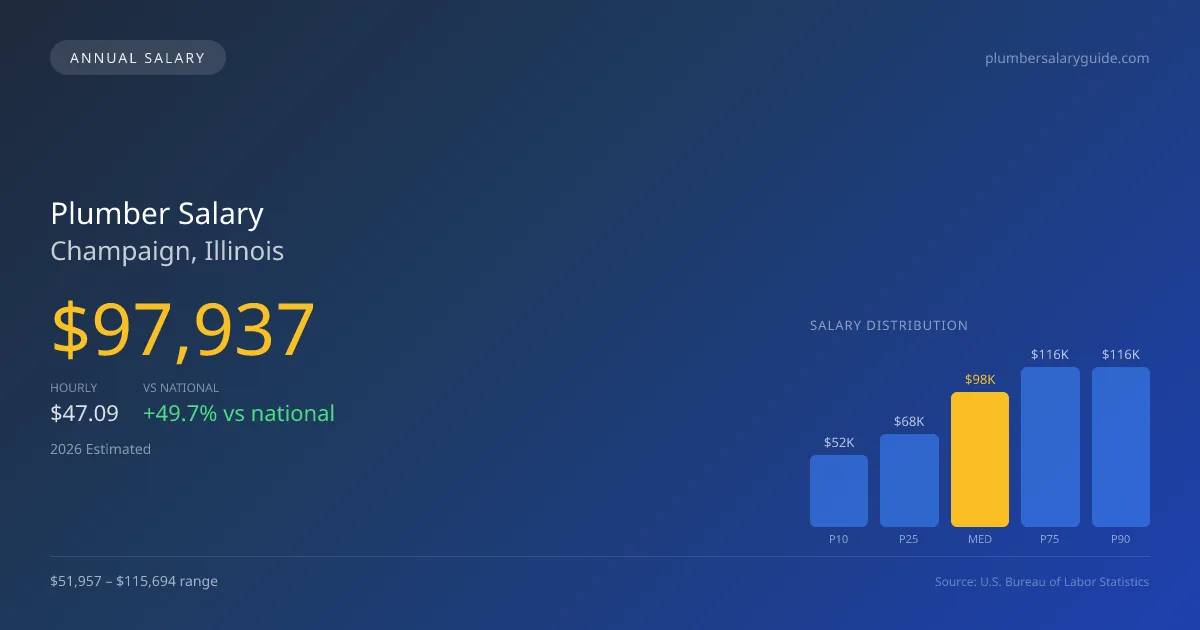
Champaign, Illinois, offers a promising outlook for plumbers, with a projected median salary of $97,937 in 2026, significantly above the national median of $65,408. The local pay range for plumbers spans from $51,957 at the 10th percentile to $115,694 at the 90th percentile, as reported by the Bureau of Labor Statistics (BLS) based on 2025 data, projected to 2026. A key factor influencing these earnings is the dominance of union-affiliated pipefitters, particularly those associated with the United Association (UA), who enjoy premium wages often 30-50% higher than those in non-union residential service roles. This discrepancy reflects the broader dynamics of the local market, where the demand for skilled labor remains strong.
Salary Breakdown
| Percentile | Annual | Hourly |
|---|---|---|
| Entry Level (P10) | $51,957 | $24.98 |
| Lower Range (P25) | $67,581 | $32.49 |
| Median (P50)(typical) | $97,937 | $47.09 |
| Upper Range (P75) | $115,694 | $55.63 |
| Top Earners (P90) | $115,694 | $55.63 |
Median Salary Position
49.73% above the national average
2026 Salary Percentile Distribution in Champaign
In Champaign, IL, the plumber salary spread from the 10th to 90th percentile is $63,737 (2026 est.). At $97,937, the local median is 49.73% above the national median of $65,408.
Salary Calculator
At 40 hours/week in Champaign: You'd be above the median
How Champaign Plumber Pay Compares
Champaign median: $97,937/year (2026)
| Compared To | Median Salary | Champaign Pays |
|---|---|---|
| Illinois Average | $91,960 | +6.50% more |
| National Average | $65,408 | +49.73% more |
Plumbers in Champaign, IL earn a median of $97,937 per year (2026 est.), which is 49.73% higher than the national median of $65,408 and 6.50% above the Illinois state average of $91,960.
Cost-of-Living Adjusted Salary
Champaign has a cost of living 7.30% below the national average, meaning your salary goes further here.
Adjusted salary = nominal × (100 / CoL index). CoL index: 100 = national average.
Champaign, IL has a cost-of-living index of 92.704 (below the national average of 100). A plumber earning $97,937 nominally has purchasing power equivalent to $105,645 in an average-cost city — an effective 7.87% boost.
Compare Purchasing Power
Select a city to see how your salary compares after cost of living
Select a city above to compare purchasing power
2019 BLS Actual
$81,660
2025 BLS Actual
$95,530
2026 Current Est.
$97,937
2019–2027 Growth
+23.0%
Salary Trajectory for Plumbers in Champaign (2019–2027)
2019–2025: actual BLS OEWS data for this metro area. 2026+: CAGR 2.52% projection.
| Year | Annual Salary | Status |
|---|---|---|
| 2019 | $81,660 | Actual |
| 2020 | $87,070 | Actual |
| 2021 | $95,400 | Actual |
| 2022 | $103,400 | Actual |
| 2023 | $87,250 | Actual |
| 2024 | $92,470 | Actual |
| 2025 | $95,530 | Actual |
| 2026(current) | $97,937 | Estimated |
| 2027 | $100,405 | Projected |
Based on 7 years of BLS OEWS data for the Champaign metropolitan area, the median plumber salary grew 17.0% from $81,660 (2019) to $95,530 (2025). At a 2.52% compound annual growth rate, salaries are projected to reach $100,405 by 2027 — a total increase of $18,745 (22.95%) from 2019.
Note: Historical values (2019–2025) are actual BLS OEWS figures for the Champaign metropolitan area, sourced from annual Occupational Employment and Wage Statistics surveys. 2026–2026 figures are current estimates, and 2027 values are projections, calculated using a 2.52% CAGR derived from 7-year BLS historical data. Actual salaries may vary based on employer, experience, certifications, and local market conditions.
Salary by Experience Level
| Experience | Estimated Salary Range |
|---|---|
| 0-2 years (New Graduate) | $51,957 – $67,581 |
| 3-5 years (Mid Career) | $67,581 – $97,937 |
| 5+ years (Experienced) | $97,937 – $115,694 |
| 10+ years (Top Earner) | $115,694 – $115,694 |
Plumber salary ranges estimated from BLS percentile data. Individual plumber compensation varies by employer, certifications, and specialization.
Plumber Job Market in Champaign
With approximately 390 plumbers employed in Champaign, the job market reflects robust opportunities, especially considering the area's cost of living index of 92.704, which is below the national average. This lower cost of living translates to a higher take-home purchasing power for plumbers compared to many other regions. Among local employers, union plumbing contractors, particularly those affiliated with the UA, generally offer the highest wages. Factors contributing to the wide salary range include specialization in medical gas or industrial plumbing, which command higher rates, as well as the potential for additional earnings through overtime and commissions at service companies. To maximize earnings in this market, obtaining state plumbing licenses, pursuing specialty credentials, and exploring work with union contractors are strategic pathways for plumbers in Champaign, IL.
More salary data for Champaign, IL:
Frequently Asked Questions
How much do plumbers make in Champaign, IL in 2026?
Is Champaign, IL a good place to work as a plumber?
Can plumbers make $100K in Champaign?
What is the cost-of-living adjusted plumber salary in Champaign?
How much does a plumber make per hour in Champaign?
Related Pages
Compare Salaries
Career Resources
Nearby Cities in Illinois
Written by Samuel Torres, CWP
Career Analyst
Samuel Torres has 10 years of experience in plumbing. He specializes in residential plumbing systems. He has worked with several home improvement companies.
Methodology & Data Source
Salary figures on this page are 2026 projections based on the Bureau of Labor Statistics Occupational Employment and Wage Statistics (OEWS) survey, May 2026 release. The BLS reported a median annual salary of $95,530 for plumbersin the Champaign metropolitan area. A 2.52% compound annual growth rate (CAGR), calculated from 6-year national BLS wage trends, was applied to project current 2026 compensation. Percentile ranges (P10–P90) represent the full salary distribution across experience levels and practice settings in this market.
Data Sources & Methodology
Source: BLS, OEWS, 7-year dataset (–). Per-city data from annual BLS metropolitan area surveys.
2026 figures are projected from 2025 BLS data using a compound annual growth rate (CAGR) of 2.52%, derived from historical BLS wage trends for plumbers (SOC 47-2152).
Compiled and verified by Samuel Torres, CWP, a licensed plumber with 10+ years of clinical experience. · View source data at BLS.gov