Plumber Salary in Springfield, IL: $96,748 (2026)
Quick Answer:A full-time plumber in Springfield, IL earns a median $96,748/year (≈ $46.51/hour) in nominal terms for 2026 — projected from BLS OEWS 2025 (SOC 47-2152). Once you factor in Springfield's price level (7% below national, BEA RPP 92.7), that paycheck buys what $104,316 would nationally. Nominal pay sits 5.3% above the Illinois state average.
Official BLS data · View source
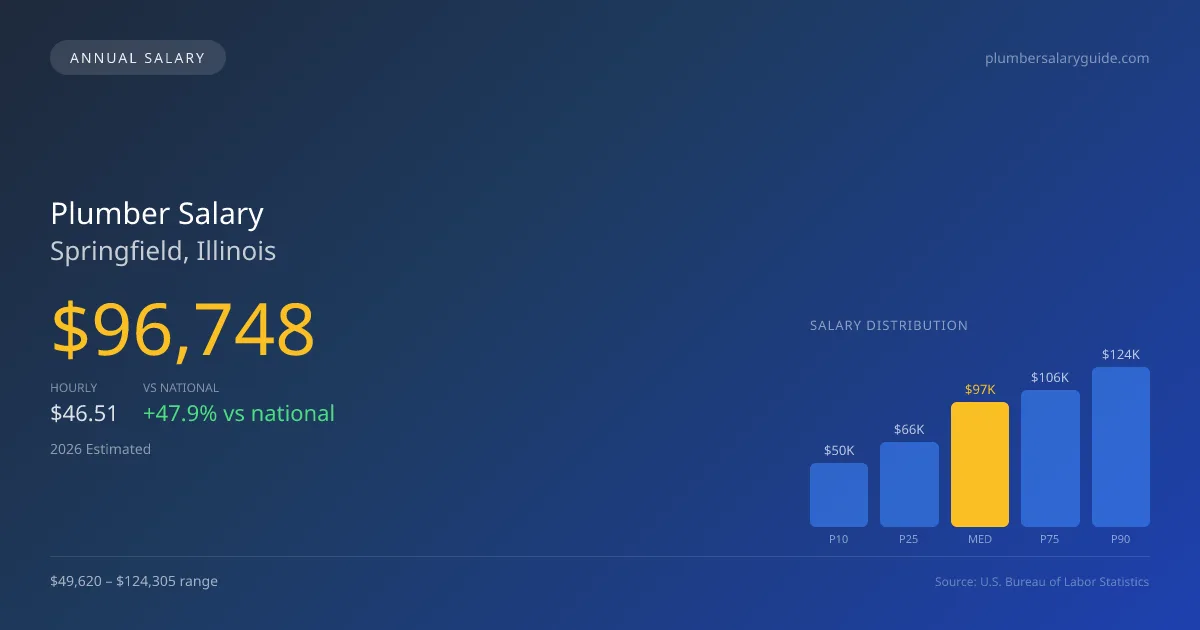
With a median annual salary of $96,748 projected for 2026, plumbers in Springfield, Illinois, enjoy a compensation level that surpasses the national median significantly, reflecting a 47.91% premium. This earning potential is complemented by a salary range that extends from $49,620 at the 10th percentile to $124,305 at the 90th percentile, showcasing the diversity in expertise and specialization within the plumbing profession. The data presented here is based on 2025 BLS OEWS data, projected to 2026, indicating that the job market is bolstered by both union and non-union positions. Union pipefitters, particularly those affiliated with the United Association (UA), generally command higher wages compared to their non-union counterparts, establishing a competitive edge in Springfield's plumbing market.
Salary Breakdown
| Percentile | Annual | Hourly |
|---|---|---|
| Entry Level (P10) | $49,620 | $23.86 |
| Lower Range (P25) | $65,797 | $31.64 |
| Median (P50)(typical) | $96,748 | $46.51 |
| Upper Range (P75) | $106,180 | $51.04 |
| Top Earners (P90) | $124,305 | $59.76 |
Median Salary Position
47.91% above the national average
2026 Salary Percentile Distribution in Springfield
In Springfield, IL, the plumber salary spread from the 10th to 90th percentile is $74,685 (2026 est.). At $96,748, the local median is 47.91% above the national median of $65,408.
Salary Calculator
At 40 hours/week in Springfield: You'd be above the median
How Springfield Plumber Pay Compares
Springfield median: $96,748/year (2026)
| Compared To | Median Salary | Springfield Pays |
|---|---|---|
| Illinois Average | $91,879 | +5.30% more |
| National Average | $65,408 | +47.91% more |
Plumbers in Springfield, IL earn a median of $96,748 per year (2026 est.), which is 47.91% higher than the national median of $65,408 and 5.30% above the Illinois state average of $91,879.
Cost-of-Living Adjusted Salary
Springfield has a cost of living 7.25% below the national average, meaning your salary goes further here.
Adjusted salary = nominal × (100 / CoL index). CoL index: 100 = national average.
Springfield, IL has a cost-of-living index of 92.745 (below the national average of 100). A plumber earning $96,748 nominally has purchasing power equivalent to $104,316 in an average-cost city — an effective 7.82% boost.
Compare Purchasing Power
Select a city to see how your salary compares after cost of living
Select a city above to compare purchasing power
2019 BLS Actual
$90,540
2025 BLS Actual
$94,370
2026 Current Est.
$96,748
2019–2027 Growth
+9.5%
Salary Trajectory for Plumbers in Springfield (2019–2027)
2019–2025: actual BLS OEWS data for this metro area. 2026+: CAGR 2.52% projection.
| Year | Annual Salary | Status |
|---|---|---|
| 2019 | $90,540 | Actual |
| 2020 | $88,480 | Actual |
| 2021 | $81,670 | Actual |
| 2022 | $85,000 | Actual |
| 2023 | $79,510 | Actual |
| 2024 | $88,070 | Actual |
| 2025 | $94,370 | Actual |
| 2026(current) | $96,748 | Estimated |
| 2027 | $99,186 | Projected |
Based on 7 years of BLS OEWS data for the Springfield metropolitan area, the median plumber salary grew 4.2% from $90,540 (2019) to $94,370 (2025). At a 2.52% compound annual growth rate, salaries are projected to reach $99,186 by 2027 — a total increase of $8,646 (9.55%) from 2019.
Note: Historical values (2019–2025) are actual BLS OEWS figures for the Springfield metropolitan area, sourced from annual Occupational Employment and Wage Statistics surveys. 2026–2026 figures are current estimates, and 2027 values are projections, calculated using a 2.52% CAGR derived from 7-year BLS historical data. Actual salaries may vary based on employer, experience, certifications, and local market conditions.
Salary by Experience Level
| Experience | Estimated Salary Range |
|---|---|
| 0-2 years (New Graduate) | $49,620 – $65,797 |
| 3-5 years (Mid Career) | $65,797 – $96,748 |
| 5+ years (Experienced) | $96,748 – $106,180 |
| 10+ years (Top Earner) | $106,180 – $124,305 |
Plumber salary ranges estimated from BLS percentile data. Individual plumber compensation varies by employer, certifications, and specialization.
Plumber Job Market in Springfield
In Springfield, the local employment landscape reveals 220 plumbers currently practicing, which provides a stable job market despite the relatively low cost of living indexed at 92.745—below the national average. This favorable cost of living can enhance take-home purchasing power, making it easier for plumbers to thrive financially. Among local employers, union plumbing contractors typically offer the highest compensation, while large service companies like Roto-Rooter or ARS also provide significant earning potential, albeit with variable commission structures for their employees. Factors influencing the wide pay spectrum include specialty skills such as medical gas and backflow prevention, where certified professionals can achieve premium wages. To maximize earnings in Springfield, plumbers should consider obtaining master licenses, diversifying their skills in high-demand areas, and exploring opportunities in industrial maintenance and union affiliations.
More salary data for Springfield, IL:
Frequently Asked Questions
How much do plumbers make in Springfield, IL in 2026?
Is Springfield, IL a good place to work as a plumber?
Can plumbers make $100K in Springfield?
What is the cost-of-living adjusted plumber salary in Springfield?
How much does a plumber make per hour in Springfield?
Related Pages
Compare Salaries
Career Resources
Nearby Cities in Illinois
Written by Samuel Torres, CWP
Career Analyst
Samuel Torres has 10 years of experience in plumbing. He specializes in residential plumbing systems. He has worked with several home improvement companies.
Methodology & Data Source
Salary figures on this page are 2026 projections based on the Bureau of Labor Statistics Occupational Employment and Wage Statistics (OEWS) survey, May 2026 release. The BLS reported a median annual salary of $94,370 for plumbersin the Springfield metropolitan area. A 2.52% compound annual growth rate (CAGR), calculated from 6-year national BLS wage trends, was applied to project current 2026 compensation. Percentile ranges (P10–P90) represent the full salary distribution across experience levels and practice settings in this market.
Data Sources & Methodology
Source: BLS, OEWS, 7-year dataset (–). Per-city data from annual BLS metropolitan area surveys.
2026 figures are projected from 2025 BLS data using a compound annual growth rate (CAGR) of 2.52%, derived from historical BLS wage trends for plumbers (SOC 47-2152).
Compiled and verified by Samuel Torres, CWP, a licensed plumber with 10+ years of clinical experience. · View source data at BLS.gov