Plumber Salary in Burlington, IA: $62,027 (2026)
Quick Answer:A full-time plumber in Burlington, IA earns a median $62,027/year (≈ $29.82/hour) in nominal terms for 2026 — projected from BLS OEWS 2025 (SOC 47-2152). Once you factor in Burlington's price level (10% below national, BEA RPP 90.4), that paycheck buys what $68,614 would nationally. Nominal pay sits 4.0% below the Iowa state average.
Based on BLS state-level estimates · View source
In Burlington, Iowa, the projected median annual salary for plumbers in 2026 is $62,027. This figure represents a 5.17% dip compared to the national median of $65,408. The pay range for plumbers here spans from $45,262 at the 10th percentile to $96,141 at the 90th percentile, highlighting a wide disparity based on experience and specialization. These estimates stem from state-level data and regional cost of living adjustments, reflecting the unique market dynamics in Burlington. While non-union service plumbers may earn less, union pipefitters, especially those with UA (United Association) credentials, generally command higher wages due to their specialized training and certification, creating a more competitive job environment for those in the skilled trades.
About the Burlington Market
Salary estimated from Iowa average ($62,000) adjusted for local cost of living.
Salary Breakdown
| Percentile | Annual | Hourly |
|---|---|---|
| Entry Level (P10) | $45,262 | $21.76 |
| Lower Range (P25) | $49,754 | $23.92 |
| Median (P50)(typical) | $62,027 | $29.82 |
| Upper Range (P75) | $79,395 | $38.17 |
| Top Earners (P90) | $96,141 | $46.23 |
Median Salary Position
5.17% below the national average
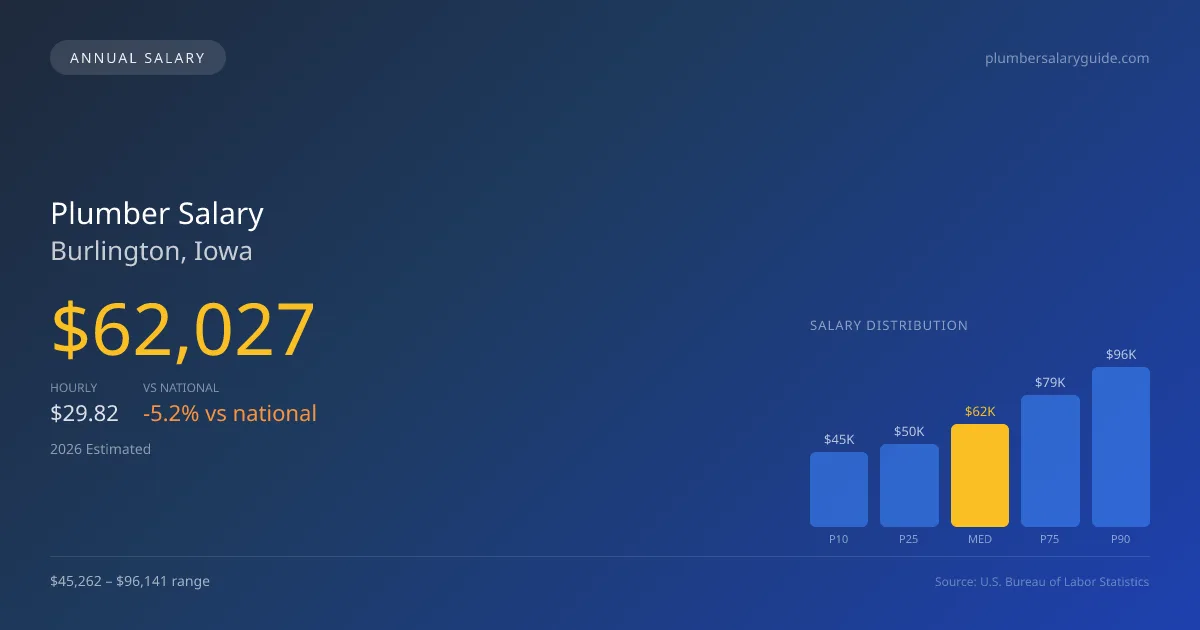
2026 Salary Percentile Distribution in Burlington
In Burlington, IA, the plumber salary spread from the 10th to 90th percentile is $50,879 (2026 est.). At $62,027, the local median is 5.17% below the national median of $65,408.
Salary Calculator
At 40 hours/week in Burlington: You'd be in the lower-middle range
How Burlington Plumber Pay Compares
Burlington median: $62,027/year (2026)
| Compared To | Median Salary | Burlington Pays |
|---|---|---|
| Iowa Average | $64,611 | -4.00% less |
| National Average | $65,408 | -5.17% less |
Plumbers in Burlington, IA earn a median of $62,027 per year (2026 est.), which is 5.17% lower than the national median of $65,408 and 4.00% below the Iowa state average of $64,611.
Cost-of-Living Adjusted Salary
Burlington has a cost of living 9.60% below the national average, meaning your salary goes further here.
Adjusted salary = nominal × (100 / CoL index). CoL index: 100 = national average.
Burlington, IA has a cost-of-living index of 90.4 (below the national average of 100). A plumber earning $62,027 nominally has purchasing power equivalent to $68,614 in an average-cost city — an effective 10.62% boost.
Compare Purchasing Power
Select a city to see how your salary compares after cost of living
Select a city above to compare purchasing power
2019 BLS Actual
$52,309
2025 BLS Actual
$60,502
2026 Current Est.
$62,027
2019–2027 Growth
+21.6%
Salary Trajectory for Plumbers in Burlington (2019–2027)
2019–2025: actual BLS OEWS data for this metro area. 2026+: CAGR 2.52% projection.
| Year | Annual Salary | Status |
|---|---|---|
| 2019 | $52,309 | Actual |
| 2020 | $53,418 | Actual |
| 2021 | $56,785 | Actual |
| 2022 | $56,984 | Actual |
| 2023 | $58,368 | Actual |
| 2024 | $53,817 | Actual |
| 2025 | $60,502 | Actual |
| 2026(current) | $62,027 | Estimated |
| 2027 | $63,590 | Projected |
Based on 7 years of BLS OEWS data for the Burlington metropolitan area, the median plumber salary grew 15.7% from $52,309 (2019) to $60,502 (2025). At a 2.52% compound annual growth rate, salaries are projected to reach $63,590 by 2027 — a total increase of $11,281 (21.57%) from 2019.
Note: Historical values (2019–2025) are actual BLS OEWS figures for the Burlington metropolitan area, sourced from annual Occupational Employment and Wage Statistics surveys. 2026–2026 figures are current estimates, and 2027 values are projections, calculated using a 2.52% CAGR derived from 7-year BLS historical data. Actual salaries may vary based on employer, experience, certifications, and local market conditions.
Salary by Experience Level
| Experience | Estimated Salary Range |
|---|---|
| 0-2 years (New Graduate) | $45,262 – $49,754 |
| 3-5 years (Mid Career) | $49,754 – $62,027 |
| 5+ years (Experienced) | $62,027 – $79,395 |
| 10+ years (Top Earner) | $79,395 – $96,141 |
Plumber salary ranges estimated from BLS percentile data. Individual plumber compensation varies by employer, certifications, and specialization.
Plumber Job Market in Burlington
The plumbing job market in Burlington comprises only four employed plumbers, making it a small yet focused industry. With a cost-of-living index of 90.4, the relatively lower living expenses in Burlington could enhance take-home purchasing power, albeit the salaries remain modest compared to national averages. Within the local sector, union contractors typically offer the most competitive pay, followed by specialized sectors like medical gas and industrial pipefitting. The variance in earnings reflects several factors, including licensing levels, specialty training, and the commission structures employed by large service companies such as Roto-Rooter and ARS/Rescue Rooter. For those looking to maximize their earnings, pursuing a master license, gaining certifications in specialized plumbing areas, and aiming for union membership can significantly impact income potential in Burlington, IA.
More salary data for Burlington, IA:
Frequently Asked Questions
How much do plumbers make in Burlington, IA in 2026?
Is Burlington, IA a good place to work as a plumber?
Can plumbers make $100K in Burlington?
What is the cost-of-living adjusted plumber salary in Burlington?
How much does a plumber make per hour in Burlington?
Related Pages
Compare Salaries
Career Resources
Written by Samuel Torres, CWP
Career Analyst
Samuel Torres has 10 years of experience in plumbing. He specializes in residential plumbing systems. He has worked with several home improvement companies.
Methodology & Data Source
Salary figures on this page are 2026 projections based on the Bureau of Labor Statistics Occupational Employment and Wage Statistics (OEWS) survey, May 2026 release. The BLS reported a median annual salary of $60,502 for plumbersin the Burlington metropolitan area. A 2.52% compound annual growth rate (CAGR), calculated from 6-year national BLS wage trends, was applied to project current 2026 compensation. Percentile ranges (P10–P90) represent the full salary distribution across experience levels and practice settings in this market.
Data Sources & Methodology
Salary data for Burlington is estimated from official BLS state-level occupational wage data (2025), adjusted for regional cost-of-living differences using BEA RPP (Regional Price Parities).
2026 figures are projected from 2025 BLS data using a compound annual growth rate (CAGR) of 2.52%, derived from historical BLS wage trends for plumbers (SOC 47-2152).
Compiled and verified by Samuel Torres, CWP, a licensed plumber with 10+ years of clinical experience. · View source data at BLS.gov