Plumber Salary in Lexington Park, MD: $59,154 (2026)
Quick Answer:A full-time plumber in Lexington Park, MD earns a median $59,154/year (≈ $28.44/hour) in nominal terms for 2026 — projected from BLS OEWS 2025 (SOC 47-2152). Once you factor in Lexington Park's price level (1% above national, BEA RPP 100.8), that paycheck buys what $58,708 would nationally. Nominal pay sits 17.3% below the Maryland state average.
Official BLS data · View source
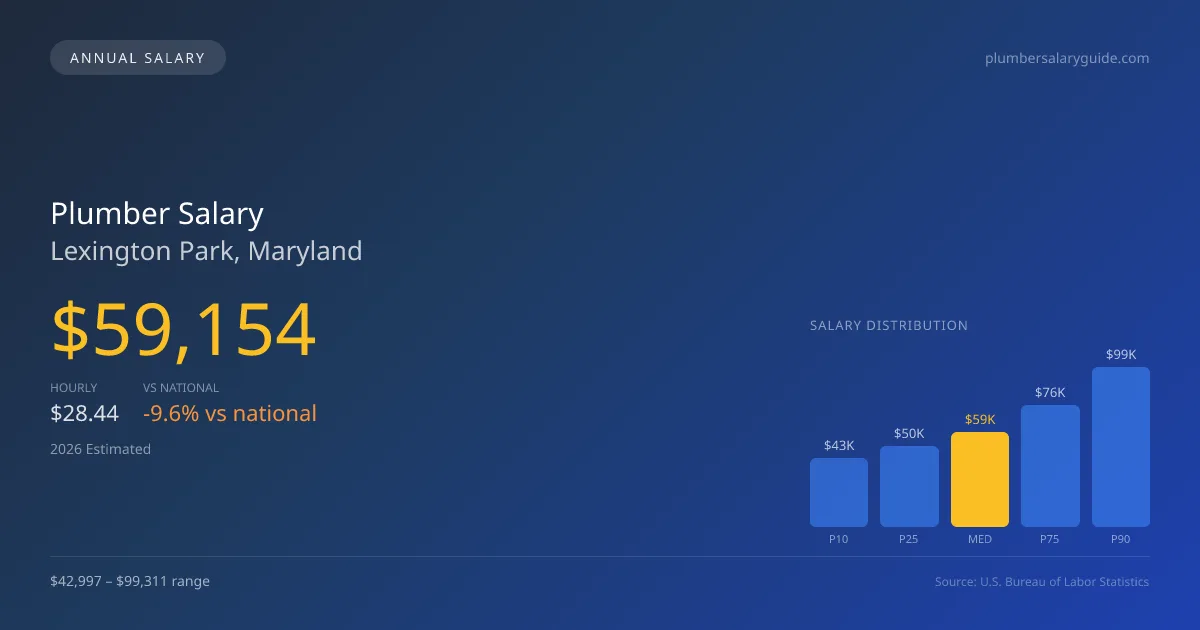
In 2026, plumbers in Lexington Park, MD, can expect to earn a median salary of $59,154, a figure that illustrates the trade-off between being an employee in the plumbing service sector and self-employed contracting. With a salary range that spans from $42,997 at the 10th percentile to $99,311 at the 90th percentile, this data, derived from official Bureau of Labor Statistics (BLS) OEWS surveys, highlights the potential for substantial earnings, especially for those with specialized skills or those in management positions. However, when compared to the national median of $65,408, the local compensation suggests that plumbers in Lexington Park earn about 9.56% less than the national average. This discrepancy can be attributed to regional economic factors and the specific nature of the job market in the area.
Salary Breakdown
| Percentile | Annual | Hourly |
|---|---|---|
| Entry Level (P10) | $42,997 | $20.68 |
| Lower Range (P25) | $50,368 | $24.22 |
| Median (P50)(typical) | $59,154 | $28.44 |
| Upper Range (P75) | $75,998 | $36.54 |
| Top Earners (P90) | $99,311 | $47.74 |
Median Salary Position
9.56% below the national average
2026 Salary Percentile Distribution in Lexington Park
In Lexington Park, MD, the plumber salary spread from the 10th to 90th percentile is $56,314 (2026 est.). At $59,154, the local median is 9.56% below the national median of $65,408.
Salary Calculator
At 40 hours/week in Lexington Park: You'd be in the lower-middle range
How Lexington Park Plumber Pay Compares
Lexington Park median: $59,154/year (2026)
| Compared To | Median Salary | Lexington Park Pays |
|---|---|---|
| Maryland Average | $71,528 | -17.30% less |
| National Average | $65,408 | -9.56% less |
Plumbers in Lexington Park, MD earn a median of $59,154 per year (2026 est.), which is 9.56% lower than the national median of $65,408 and 17.30% below the Maryland state average of $71,528.
Cost-of-Living Adjusted Salary
Lexington Park has a cost of living 0.76% above the national average.
Adjusted salary = nominal × (100 / CoL index). CoL index: 100 = national average.
Lexington Park, MD has a cost-of-living index of 100.76 (above the national average of 100). While the nominal salary of $59,154 is competitive, the higher cost of living reduces purchasing power to an effective $58,708 — a 0.75% reduction.
Compare Purchasing Power
Select a city to see how your salary compares after cost of living
Select a city above to compare purchasing power
2019 BLS Actual
$49,886
2025 BLS Actual
$57,700
2026 Current Est.
$59,154
2019–2027 Growth
+21.6%
Salary Trajectory for Plumbers in Lexington Park (2019–2027)
2019–2025: actual BLS OEWS data for this metro area. 2026+: CAGR 2.52% projection.
| Year | Annual Salary | Status |
|---|---|---|
| 2019 | $49,886 | Actual |
| 2020 | $50,944 | Actual |
| 2021 | $54,155 | Actual |
| 2022 | $54,345 | Actual |
| 2023 | $55,665 | Actual |
| 2024 | $57,930 | Actual |
| 2025 | $57,700 | Actual |
| 2026(current) | $59,154 | Estimated |
| 2027 | $60,645 | Projected |
Based on 7 years of BLS OEWS data for the Lexington Park metropolitan area, the median plumber salary grew 15.7% from $49,886 (2019) to $57,700 (2025). At a 2.52% compound annual growth rate, salaries are projected to reach $60,645 by 2027 — a total increase of $10,759 (21.57%) from 2019.
Note: Historical values (2019–2025) are actual BLS OEWS figures for the Lexington Park metropolitan area, sourced from annual Occupational Employment and Wage Statistics surveys. 2026–2026 figures are current estimates, and 2027 values are projections, calculated using a 2.52% CAGR derived from 7-year BLS historical data. Actual salaries may vary based on employer, experience, certifications, and local market conditions.
Salary by Experience Level
| Experience | Estimated Salary Range |
|---|---|
| 0-2 years (New Graduate) | $42,997 – $50,368 |
| 3-5 years (Mid Career) | $50,368 – $59,154 |
| 5+ years (Experienced) | $59,154 – $75,998 |
| 10+ years (Top Earner) | $75,998 – $99,311 |
Plumber salary ranges estimated from BLS percentile data. Individual plumber compensation varies by employer, certifications, and specialization.
Plumber Job Market in Lexington Park
Employment opportunities for plumbing professionals in Lexington Park are relatively robust, with approximately 260 plumbers currently working in the area. The cost of living index stands at 100.76, slightly above the national average, which influences overall purchasing power for local plumbers. Among the various employers in Lexington Park, union plumbing contractors affiliated with the United Association typically offer the highest wages, benefiting from strong collective bargaining power. In contrast, non-union and open-shop contractors often present more variable earning potential based on commission and service calls. Factors such as licensing, overtime, and specialty skills—like medical gas installation—significantly affect the salary spread, with certified individuals earning more. To maximize pay in this market, plumbers should focus on gaining additional credentials and licensing, particularly in high-demand specialties, and consider the stability and benefits offered by union employment.
More salary data for Lexington Park, MD:
Frequently Asked Questions
How much do plumbers make in Lexington Park, MD in 2026?
Is Lexington Park, MD a good place to work as a plumber?
Can plumbers make $100K in Lexington Park?
What is the cost-of-living adjusted plumber salary in Lexington Park?
How much does a plumber make per hour in Lexington Park?
Related Pages
Compare Salaries
Career Resources
Nearby Cities in Maryland
Written by Samuel Torres, CWP
Career Analyst
Samuel Torres has 10 years of experience in plumbing. He specializes in residential plumbing systems. He has worked with several home improvement companies.
Methodology & Data Source
Salary figures on this page are 2026 projections based on the Bureau of Labor Statistics Occupational Employment and Wage Statistics (OEWS) survey, May 2026 release. The BLS reported a median annual salary of $57,700 for plumbersin the Lexington Park metropolitan area. A 2.52% compound annual growth rate (CAGR), calculated from 6-year national BLS wage trends, was applied to project current 2026 compensation. Percentile ranges (P10–P90) represent the full salary distribution across experience levels and practice settings in this market.
Data Sources & Methodology
Source: BLS, OEWS, 2-year dataset (–). Per-city data from annual BLS metropolitan area surveys.
2026 figures are projected from 2025 BLS data using a compound annual growth rate (CAGR) of 2.52%, derived from historical BLS wage trends for plumbers (SOC 47-2152).
Compiled and verified by Samuel Torres, CWP, a licensed plumber with 10+ years of clinical experience. · View source data at BLS.gov