Plumber Salary in Arlington, MA: $82,929 (2026)
Quick Answer:A full-time plumber in Arlington, MA earns a median $82,929/year (≈ $39.87/hour) in nominal terms for 2026 — projected from BLS OEWS 2025 (SOC 47-2152). Once you factor in Arlington's price level (9% above national, BEA RPP 108.5), that paycheck buys what $76,432 would nationally. Nominal pay sits 1.5% below the Massachusetts state average.
Based on BLS state-level estimates · View source
In 2026, a plumber in Arlington, Massachusetts is projected to earn a median annual salary of $82,929, which significantly exceeds the national median of $65,408 by around 26.79%. The salary range in this market spans from $58,183 at the 10th percentile to $128,541 at the 90th percentile, reflecting the diverse opportunities available for plumbers. These estimates are tailored from state-level data and take into account local economic conditions. The salary landscape in Arlington is shaped largely by the union versus non-union dynamic; UA union pipefitters typically command higher wages than non-union service plumbers. Overall, the strong salary prospects indicate a competitive job market for plumbing professionals in this Massachusetts town.
About the Arlington Market
Salary estimated from Massachusetts average ($82,000) adjusted for local cost of living.
Salary Breakdown
| Percentile | Annual | Hourly |
|---|---|---|
| Entry Level (P10) | $58,183 | $27.98 |
| Lower Range (P25) | $64,886 | $31.20 |
| Median (P50)(typical) | $82,929 | $39.87 |
| Upper Range (P75) | $106,149 | $51.03 |
| Top Earners (P90) | $128,541 | $61.80 |
Median Salary Position
26.79% above the national average
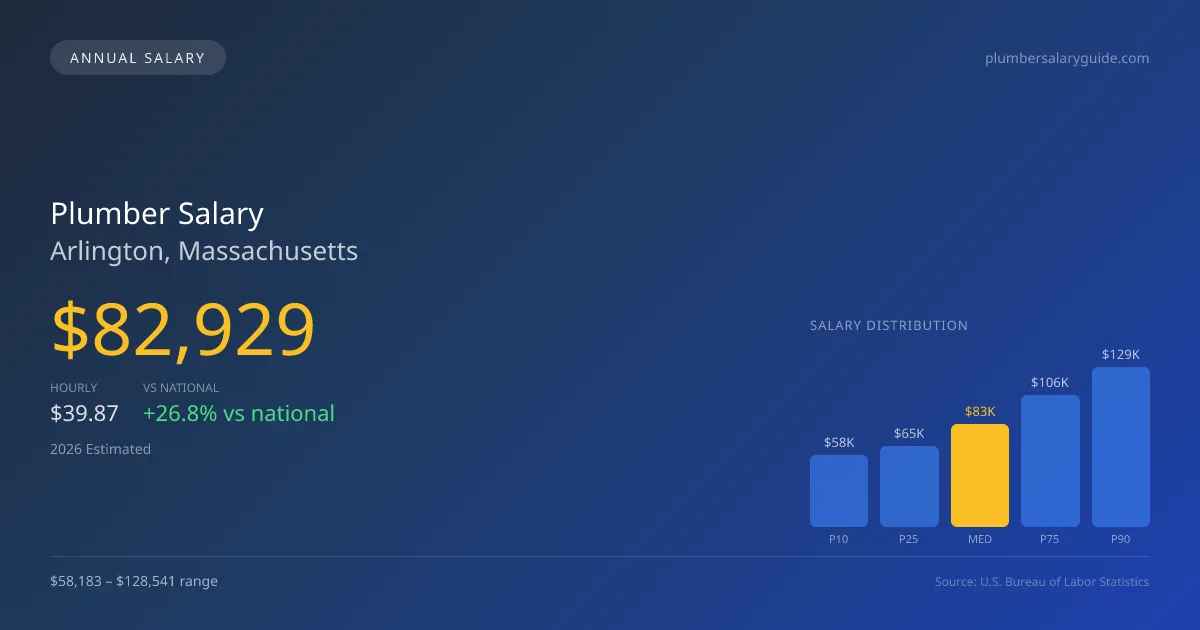
2026 Salary Percentile Distribution in Arlington
In Arlington, MA, the plumber salary spread from the 10th to 90th percentile is $70,358 (2026 est.). At $82,929, the local median is 26.79% above the national median of $65,408.
Salary Calculator
At 40 hours/week in Arlington: You'd be in the lower-middle range
How Arlington Plumber Pay Compares
Arlington median: $82,929/year (2026)
| Compared To | Median Salary | Arlington Pays |
|---|---|---|
| Massachusetts Average | $84,192 | -1.50% less |
| National Average | $65,408 | +26.79% more |
Plumbers in Arlington, MA earn a median of $82,929 per year (2026 est.), which is 26.79% higher than the national median of $65,408 and 1.50% below the Massachusetts state average of $84,192.
Cost-of-Living Adjusted Salary
Arlington has a cost of living 8.50% above the national average.
Adjusted salary = nominal × (100 / CoL index). CoL index: 100 = national average.
Arlington, MA has a cost-of-living index of 108.5 (above the national average of 100). While the nominal salary of $82,929 is competitive, the higher cost of living reduces purchasing power to an effective $76,432 — a 7.83% reduction.
Compare Purchasing Power
Select a city to see how your salary compares after cost of living
Select a city above to compare purchasing power
2019 BLS Actual
$69,936
2025 BLS Actual
$80,891
2026 Current Est.
$82,929
2019–2027 Growth
+21.6%
Salary Trajectory for Plumbers in Arlington (2019–2027)
2019–2025: actual BLS OEWS data for this metro area. 2026+: CAGR 2.52% projection.
| Year | Annual Salary | Status |
|---|---|---|
| 2019 | $69,936 | Actual |
| 2020 | $71,420 | Actual |
| 2021 | $75,921 | Actual |
| 2022 | $76,187 | Actual |
| 2023 | $78,038 | Actual |
| 2024 | $87,644 | Actual |
| 2025 | $80,891 | Actual |
| 2026(current) | $82,929 | Estimated |
| 2027 | $85,019 | Projected |
Based on 7 years of BLS OEWS data for the Arlington metropolitan area, the median plumber salary grew 15.7% from $69,936 (2019) to $80,891 (2025). At a 2.52% compound annual growth rate, salaries are projected to reach $85,019 by 2027 — a total increase of $15,083 (21.57%) from 2019.
Note: Historical values (2019–2025) are actual BLS OEWS figures for the Arlington metropolitan area, sourced from annual Occupational Employment and Wage Statistics surveys. 2026–2026 figures are current estimates, and 2027 values are projections, calculated using a 2.52% CAGR derived from 7-year BLS historical data. Actual salaries may vary based on employer, experience, certifications, and local market conditions.
Salary by Experience Level
| Experience | Estimated Salary Range |
|---|---|
| 0-2 years (New Graduate) | $58,183 – $64,886 |
| 3-5 years (Mid Career) | $64,886 – $82,929 |
| 5+ years (Experienced) | $82,929 – $106,149 |
| 10+ years (Top Earner) | $106,149 – $128,541 |
Plumber salary ranges estimated from BLS percentile data. Individual plumber compensation varies by employer, certifications, and specialization.
Plumber Job Market in Arlington
With only nine plumbers currently employed in Arlington, the job market may seem limited, but the earning potential is influenced by various factors including employer type and the local cost of living index, which stands at 108.5. This higher-than-average cost of living requires plumbers to maximize their take-home pay strategically. Those working with UA union contractors generally earn the most, benefiting from pipefitter and steamfitter premiums, while non-union residential and light commercial contractors offer competing rates. Specializations such as medical gas and industrial pipefitting can also yield higher pay. To increase earnings, plumbers should consider acquiring specialty credentials, obtaining both master and contractor licenses for ownership opportunities, and exploring commission structures at large service companies like Roto-Rooter or ARS. Given the aging workforce and infrastructure, the demand for skilled plumbers is strong, making it a viable career choice for those entering the field.
More salary data for Arlington, MA:
Frequently Asked Questions
How much do plumbers make in Arlington, MA in 2026?
Is Arlington, MA a good place to work as a plumber?
Can plumbers make $100K in Arlington?
What is the cost-of-living adjusted plumber salary in Arlington?
How much does a plumber make per hour in Arlington?
Related Pages
Compare Salaries
Career Resources
Nearby Cities in Massachusetts
Written by Samuel Torres, CWP
Career Analyst
Samuel Torres has 10 years of experience in plumbing. He specializes in residential plumbing systems. He has worked with several home improvement companies.
Methodology & Data Source
Salary figures on this page are 2026 projections based on the Bureau of Labor Statistics Occupational Employment and Wage Statistics (OEWS) survey, May 2026 release. The BLS reported a median annual salary of $80,891 for plumbersin the Arlington metropolitan area. A 2.52% compound annual growth rate (CAGR), calculated from 6-year national BLS wage trends, was applied to project current 2026 compensation. Percentile ranges (P10–P90) represent the full salary distribution across experience levels and practice settings in this market.
Data Sources & Methodology
Salary data for Arlington is estimated from official BLS state-level occupational wage data (2025), adjusted for regional cost-of-living differences using BEA RPP (Regional Price Parities).
2026 figures are projected from 2025 BLS data using a compound annual growth rate (CAGR) of 2.52%, derived from historical BLS wage trends for plumbers (SOC 47-2152).
Compiled and verified by Samuel Torres, CWP, a licensed plumber with 10+ years of clinical experience. · View source data at BLS.gov