Plumber Salary in Chelsea, MA: $83,412 (2026)
Quick Answer:A full-time plumber in Chelsea, MA earns a median $83,412/year (≈ $40.11/hour) in nominal terms for 2026 — projected from BLS OEWS 2025 (SOC 47-2152). Once you factor in Chelsea's price level (9% above national, BEA RPP 108.5), that paycheck buys what $76,877 would nationally. Nominal pay sits 0.9% below the Massachusetts state average.
Based on BLS state-level estimates · View source
In Chelsea, Massachusetts, the 2026 median annual salary for a plumber is projected to reach $83,412, significantly higher than the national median of $65,408. This competitive pay range spans from $59,248 for entry-level positions to $129,289 for the most experienced plumbers. These figures reflect estimates based on 2025 BLS data, adjusted for local cost-of-living factors, which in Chelsea shows a cost of living index of 108.5, indicating higher than average expenses. For plumbers seeking to maximize their earning potential, specializing in high-demand areas, such as medical gas and industrial installations, can lead to additional compensation, as expertise in these services is increasingly sought after in modern plumbing.
About the Chelsea Market
Salary estimated from Massachusetts average ($82,000) adjusted for local cost of living.
Salary Breakdown
| Percentile | Annual | Hourly |
|---|---|---|
| Entry Level (P10) | $59,248 | $28.48 |
| Lower Range (P25) | $65,865 | $31.67 |
| Median (P50)(typical) | $83,412 | $40.11 |
| Upper Range (P75) | $106,767 | $51.33 |
| Top Earners (P90) | $129,289 | $62.16 |
Median Salary Position
27.53% above the national average
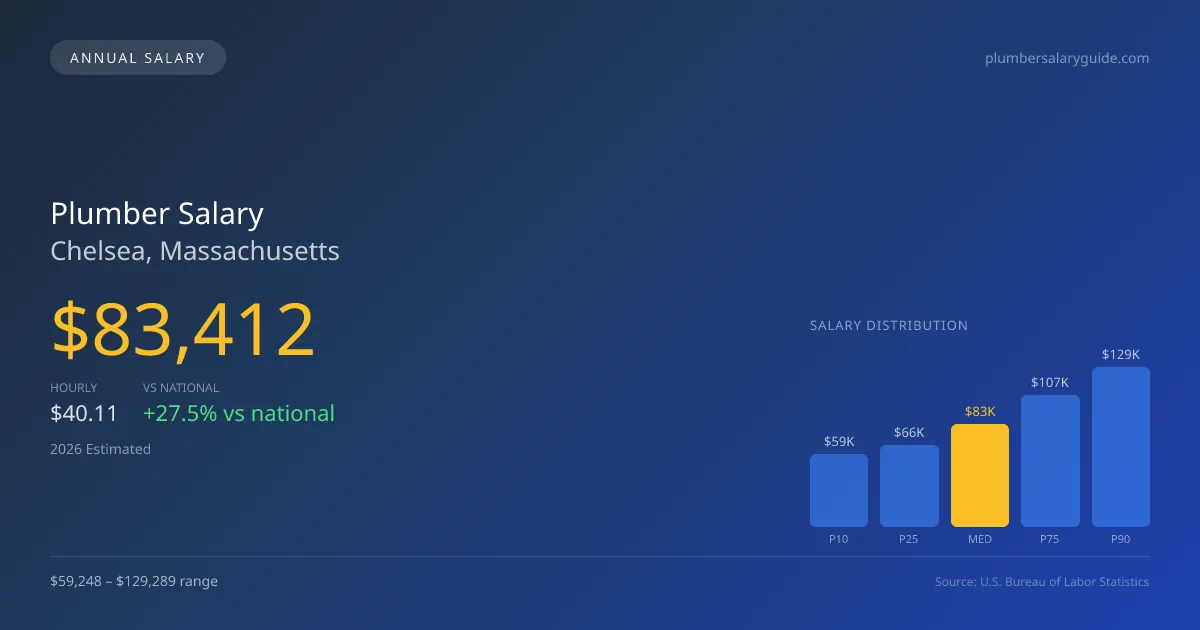
2026 Salary Percentile Distribution in Chelsea
In Chelsea, MA, the plumber salary spread from the 10th to 90th percentile is $70,041 (2026 est.). At $83,412, the local median is 27.53% above the national median of $65,408.
Salary Calculator
At 40 hours/week in Chelsea: You'd be in the lower-middle range
How Chelsea Plumber Pay Compares
Chelsea median: $83,412/year (2026)
| Compared To | Median Salary | Chelsea Pays |
|---|---|---|
| Massachusetts Average | $84,170 | -0.90% less |
| National Average | $65,408 | +27.53% more |
Plumbers in Chelsea, MA earn a median of $83,412 per year (2026 est.), which is 27.53% higher than the national median of $65,408 and 0.90% below the Massachusetts state average of $84,170.
Cost-of-Living Adjusted Salary
Chelsea has a cost of living 8.50% above the national average.
Adjusted salary = nominal × (100 / CoL index). CoL index: 100 = national average.
Chelsea, MA has a cost-of-living index of 108.5 (above the national average of 100). While the nominal salary of $83,412 is competitive, the higher cost of living reduces purchasing power to an effective $76,877 — a 7.83% reduction.
Compare Purchasing Power
Select a city to see how your salary compares after cost of living
Select a city above to compare purchasing power
2019 BLS Actual
$70,344
2025 BLS Actual
$81,362
2026 Current Est.
$83,412
2019–2027 Growth
+21.6%
Salary Trajectory for Plumbers in Chelsea (2019–2027)
2019–2025: actual BLS OEWS data for this metro area. 2026+: CAGR 2.52% projection.
| Year | Annual Salary | Status |
|---|---|---|
| 2019 | $70,344 | Actual |
| 2020 | $71,836 | Actual |
| 2021 | $76,363 | Actual |
| 2022 | $76,631 | Actual |
| 2023 | $78,493 | Actual |
| 2024 | $88,155 | Actual |
| 2025 | $81,362 | Actual |
| 2026(current) | $83,412 | Estimated |
| 2027 | $85,514 | Projected |
Based on 7 years of BLS OEWS data for the Chelsea metropolitan area, the median plumber salary grew 15.7% from $70,344 (2019) to $81,362 (2025). At a 2.52% compound annual growth rate, salaries are projected to reach $85,514 by 2027 — a total increase of $15,170 (21.57%) from 2019.
Note: Historical values (2019–2025) are actual BLS OEWS figures for the Chelsea metropolitan area, sourced from annual Occupational Employment and Wage Statistics surveys. 2026–2026 figures are current estimates, and 2027 values are projections, calculated using a 2.52% CAGR derived from 7-year BLS historical data. Actual salaries may vary based on employer, experience, certifications, and local market conditions.
Salary by Experience Level
| Experience | Estimated Salary Range |
|---|---|
| 0-2 years (New Graduate) | $59,248 – $65,865 |
| 3-5 years (Mid Career) | $65,865 – $83,412 |
| 5+ years (Experienced) | $83,412 – $106,767 |
| 10+ years (Top Earner) | $106,767 – $129,289 |
Plumber salary ranges estimated from BLS percentile data. Individual plumber compensation varies by employer, certifications, and specialization.
Plumber Job Market in Chelsea
Analyzing the local job market in Chelsea reveals that only six plumbers are currently employed in the area, pointing to a potentially ripe environment for career growth and opportunities. However, with the cost of living being above average, understanding employer dynamics is key for maximizing plumber pay in Chelsea, MA. Compensation varies widely, with union plumbing contractors generally offering higher wages compared to non-union employers, often due to the influence of pipefitter and steamfitter scales. Self-employed plumbers might also find lucrative opportunities, but success often hinges on their ability to manage operational costs effectively. Strategies for improving earnings include obtaining specialized certifications, such as those for medical gas or backflow prevention, as well as pursuing a master license to enhance credibility and service offerings. Overall, the combination of a competitive salary outlook and targeted skill development can significantly enhance a plumber's financial prospects in Chelsea.
More salary data for Chelsea, MA:
Frequently Asked Questions
How much do plumbers make in Chelsea, MA in 2026?
Is Chelsea, MA a good place to work as a plumber?
Can plumbers make $100K in Chelsea?
What is the cost-of-living adjusted plumber salary in Chelsea?
How much does a plumber make per hour in Chelsea?
Related Pages
Compare Salaries
Career Resources
Nearby Cities in Massachusetts
Written by Samuel Torres, CWP
Career Analyst
Samuel Torres has 10 years of experience in plumbing. He specializes in residential plumbing systems. He has worked with several home improvement companies.
Methodology & Data Source
Salary figures on this page are 2026 projections based on the Bureau of Labor Statistics Occupational Employment and Wage Statistics (OEWS) survey, May 2026 release. The BLS reported a median annual salary of $81,362 for plumbersin the Chelsea metropolitan area. A 2.52% compound annual growth rate (CAGR), calculated from 6-year national BLS wage trends, was applied to project current 2026 compensation. Percentile ranges (P10–P90) represent the full salary distribution across experience levels and practice settings in this market.
Data Sources & Methodology
Salary data for Chelsea is estimated from official BLS state-level occupational wage data (2025), adjusted for regional cost-of-living differences using BEA RPP (Regional Price Parities).
2026 figures are projected from 2025 BLS data using a compound annual growth rate (CAGR) of 2.52%, derived from historical BLS wage trends for plumbers (SOC 47-2152).
Compiled and verified by Samuel Torres, CWP, a licensed plumber with 10+ years of clinical experience. · View source data at BLS.gov