Plumber Salary in Lawrence, MA: $82,099 (2026)
Quick Answer:A full-time plumber in Lawrence, MA earns a median $82,099/year (≈ $39.47/hour) in nominal terms for 2026 — projected from BLS OEWS 2025 (SOC 47-2152). Once you factor in Lawrence's price level (9% above national, BEA RPP 108.5), that paycheck buys what $75,667 would nationally. Nominal pay sits 2.5% below the Massachusetts state average.
Based on BLS state-level estimates · View source
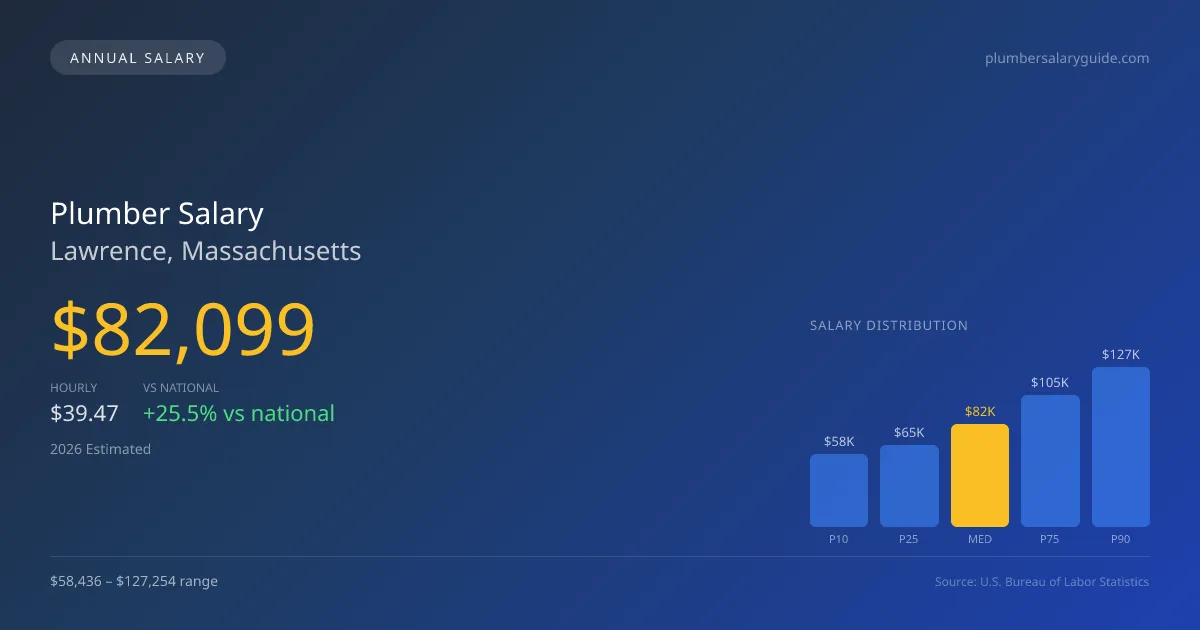
In 2026, a plumber salary in Lawrence, MA, is projected to reach a median of $82,099, reflecting a significant premium when compared to the national median of $65,408. Within this market, salaries can vary widely, with the lowest earners bringing home approximately $58,436 and the highest achieving up to $127,254. These figures, based on 2025 BLS OEWS data and adjusted for local economic conditions, indicate a robust plumbing sector in Lawrence. The presence of specialized roles, such as medical gas experts and those skilled in underground utility projects, contributes to this higher-than-average compensation. Consequently, Lawrence offers skilled plumbers strong earning potential alongside opportunities for advancement in a market characterized by a blend of residential and industrial demand.
About the Lawrence Market
Salary estimated from Massachusetts average ($82,000) adjusted for local cost of living.
Salary Breakdown
| Percentile | Annual | Hourly |
|---|---|---|
| Entry Level (P10) | $58,436 | $28.09 |
| Lower Range (P25) | $65,188 | $31.34 |
| Median (P50)(typical) | $82,099 | $39.47 |
| Upper Range (P75) | $105,087 | $50.52 |
| Top Earners (P90) | $127,254 | $61.18 |
Median Salary Position
25.52% above the national average
2026 Salary Percentile Distribution in Lawrence
In Lawrence, MA, the plumber salary spread from the 10th to 90th percentile is $68,818 (2026 est.). At $82,099, the local median is 25.52% above the national median of $65,408.
Salary Calculator
At 40 hours/week in Lawrence: You'd be in the lower-middle range
How Lawrence Plumber Pay Compares
Lawrence median: $82,099/year (2026)
| Compared To | Median Salary | Lawrence Pays |
|---|---|---|
| Massachusetts Average | $84,204 | -2.50% less |
| National Average | $65,408 | +25.52% more |
Plumbers in Lawrence, MA earn a median of $82,099 per year (2026 est.), which is 25.52% higher than the national median of $65,408 and 2.50% below the Massachusetts state average of $84,204.
Cost-of-Living Adjusted Salary
Lawrence has a cost of living 8.50% above the national average.
Adjusted salary = nominal × (100 / CoL index). CoL index: 100 = national average.
Lawrence, MA has a cost-of-living index of 108.5 (above the national average of 100). While the nominal salary of $82,099 is competitive, the higher cost of living reduces purchasing power to an effective $75,667 — a 7.83% reduction.
Compare Purchasing Power
Select a city to see how your salary compares after cost of living
Select a city above to compare purchasing power
2019 BLS Actual
$69,236
2025 BLS Actual
$80,081
2026 Current Est.
$82,099
2019–2027 Growth
+21.6%
Salary Trajectory for Plumbers in Lawrence (2019–2027)
2019–2025: actual BLS OEWS data for this metro area. 2026+: CAGR 2.52% projection.
| Year | Annual Salary | Status |
|---|---|---|
| 2019 | $69,236 | Actual |
| 2020 | $70,705 | Actual |
| 2021 | $75,161 | Actual |
| 2022 | $75,424 | Actual |
| 2023 | $77,257 | Actual |
| 2024 | $86,766 | Actual |
| 2025 | $80,081 | Actual |
| 2026(current) | $82,099 | Estimated |
| 2027 | $84,168 | Projected |
Based on 7 years of BLS OEWS data for the Lawrence metropolitan area, the median plumber salary grew 15.7% from $69,236 (2019) to $80,081 (2025). At a 2.52% compound annual growth rate, salaries are projected to reach $84,168 by 2027 — a total increase of $14,932 (21.57%) from 2019.
Note: Historical values (2019–2025) are actual BLS OEWS figures for the Lawrence metropolitan area, sourced from annual Occupational Employment and Wage Statistics surveys. 2026–2026 figures are current estimates, and 2027 values are projections, calculated using a 2.52% CAGR derived from 7-year BLS historical data. Actual salaries may vary based on employer, experience, certifications, and local market conditions.
Salary by Experience Level
| Experience | Estimated Salary Range |
|---|---|
| 0-2 years (New Graduate) | $58,436 – $65,188 |
| 3-5 years (Mid Career) | $65,188 – $82,099 |
| 5+ years (Experienced) | $82,099 – $105,087 |
| 10+ years (Top Earner) | $105,087 – $127,254 |
Plumber salary ranges estimated from BLS percentile data. Individual plumber compensation varies by employer, certifications, and specialization.
Plumber Job Market in Lawrence
The local plumbing job market in Lawrence employs around 16 plumbers, which indicates a relatively niche environment. With a cost-of-living index of 108.5, purchasing power poses a consideration for take-home pay, making competitive salaries essential for maintaining a comfortable lifestyle. Among the highest-paying employers are union plumbing contractors, which typically provide wages that can exceed those of non-union counterparts due to collective bargaining agreements through organizations like the UA (United Association). Additionally, skilled plumbers willing to specialize in areas like industrial maintenance or who hold licenses for medical gas and backflow prevention may command higher salaries. To maximize pay in this distinct market, plumbers should consider pursuing master licenses, gaining additional certifications, and leveraging the variation in pay structures found in service companies, which often pay commissions and offer overtime opportunities.
More salary data for Lawrence, MA:
Frequently Asked Questions
How much do plumbers make in Lawrence, MA in 2026?
Is Lawrence, MA a good place to work as a plumber?
Can plumbers make $100K in Lawrence?
What is the cost-of-living adjusted plumber salary in Lawrence?
How much does a plumber make per hour in Lawrence?
Related Pages
Compare Salaries
Career Resources
Nearby Cities in Massachusetts
Written by Samuel Torres, CWP
Career Analyst
Samuel Torres has 10 years of experience in plumbing. He specializes in residential plumbing systems. He has worked with several home improvement companies.
Methodology & Data Source
Salary figures on this page are 2026 projections based on the Bureau of Labor Statistics Occupational Employment and Wage Statistics (OEWS) survey, May 2026 release. The BLS reported a median annual salary of $80,081 for plumbersin the Lawrence metropolitan area. A 2.52% compound annual growth rate (CAGR), calculated from 6-year national BLS wage trends, was applied to project current 2026 compensation. Percentile ranges (P10–P90) represent the full salary distribution across experience levels and practice settings in this market.
Data Sources & Methodology
Salary data for Lawrence is estimated from official BLS state-level occupational wage data (2025), adjusted for regional cost-of-living differences using BEA RPP (Regional Price Parities).
2026 figures are projected from 2025 BLS data using a compound annual growth rate (CAGR) of 2.52%, derived from historical BLS wage trends for plumbers (SOC 47-2152).
Compiled and verified by Samuel Torres, CWP, a licensed plumber with 10+ years of clinical experience. · View source data at BLS.gov