Plumber Salary in Woburn, MA: $80,094 (2026)
Quick Answer:A full-time plumber in Woburn, MA earns a median $80,094/year (≈ $38.51/hour) in nominal terms for 2026 — projected from BLS OEWS 2025 (SOC 47-2152). Once you factor in Woburn's price level (9% above national, BEA RPP 108.5), that paycheck buys what $73,819 would nationally. Nominal pay sits 4.9% below the Massachusetts state average.
Based on BLS state-level estimates · View source
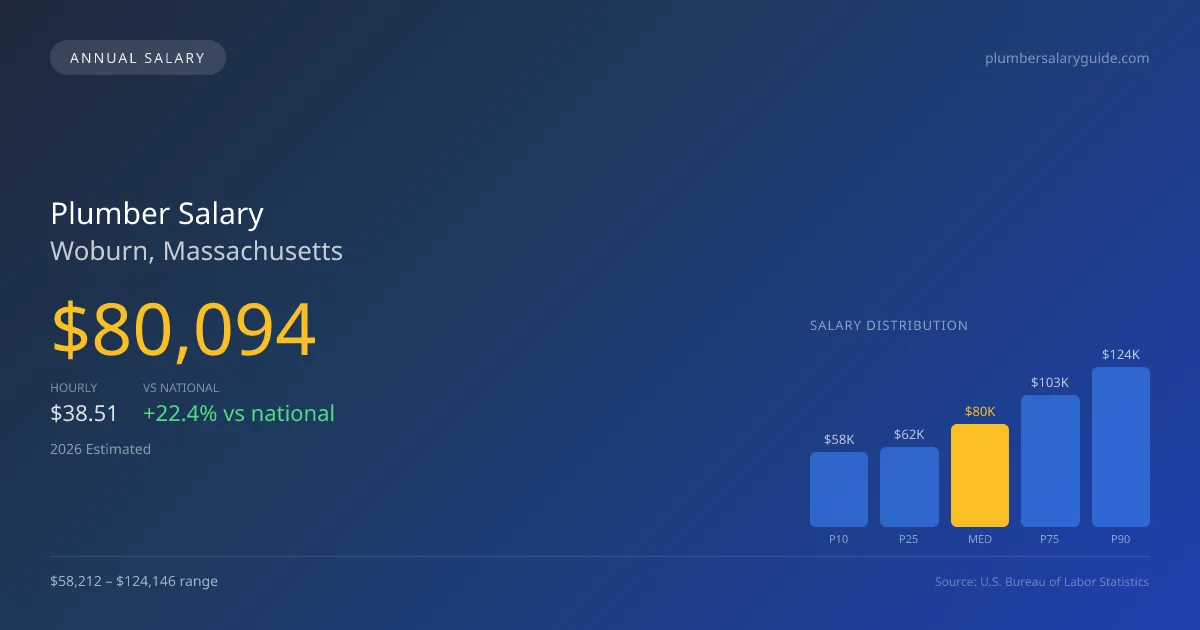
In Woburn, Massachusetts, the projected median annual salary for plumbers in 2026 is set at $80,094, which represents a significant 22.45% increase compared to the national median of $65,408. The salary range for this occupation spans from $58,212 at the lower end (10th percentile) to $124,146 at the upper end (90th percentile), indicating a varied income landscape influenced heavily by factors such as union affiliation and specialization. Estimates derived from 2025 BLS data, adjusted for regional price disparities, highlight that UA union pipefitters generally command higher wages compared to their non-union service counterparts. This ongoing pay gap suggests that unionized positions remain the most lucrative in the Woburn market, providing both stability and advantageous compensation structures for skilled professionals.
About the Woburn Market
Salary estimated from Massachusetts average ($82,000) adjusted for local cost of living.
Salary Breakdown
| Percentile | Annual | Hourly |
|---|---|---|
| Entry Level (P10) | $58,212 | $27.99 |
| Lower Range (P25) | $62,378 | $29.99 |
| Median (P50)(typical) | $80,094 | $38.51 |
| Upper Range (P75) | $102,520 | $49.29 |
| Top Earners (P90) | $124,146 | $59.69 |
Median Salary Position
22.45% above the national average
2026 Salary Percentile Distribution in Woburn
In Woburn, MA, the plumber salary spread from the 10th to 90th percentile is $65,934 (2026 est.). At $80,094, the local median is 22.45% above the national median of $65,408.
Salary Calculator
At 40 hours/week in Woburn: You'd be in the lower-middle range
How Woburn Plumber Pay Compares
Woburn median: $80,094/year (2026)
| Compared To | Median Salary | Woburn Pays |
|---|---|---|
| Massachusetts Average | $84,221 | -4.90% less |
| National Average | $65,408 | +22.45% more |
Plumbers in Woburn, MA earn a median of $80,094 per year (2026 est.), which is 22.45% higher than the national median of $65,408 and 4.90% below the Massachusetts state average of $84,221.
Cost-of-Living Adjusted Salary
Woburn has a cost of living 8.50% above the national average.
Adjusted salary = nominal × (100 / CoL index). CoL index: 100 = national average.
Woburn, MA has a cost-of-living index of 108.5 (above the national average of 100). While the nominal salary of $80,094 is competitive, the higher cost of living reduces purchasing power to an effective $73,819 — a 7.83% reduction.
Compare Purchasing Power
Select a city to see how your salary compares after cost of living
Select a city above to compare purchasing power
2019 BLS Actual
$67,545
2025 BLS Actual
$78,125
2026 Current Est.
$80,094
2019–2027 Growth
+21.6%
Salary Trajectory for Plumbers in Woburn (2019–2027)
2019–2025: actual BLS OEWS data for this metro area. 2026+: CAGR 2.52% projection.
| Year | Annual Salary | Status |
|---|---|---|
| 2019 | $67,545 | Actual |
| 2020 | $68,978 | Actual |
| 2021 | $73,325 | Actual |
| 2022 | $73,582 | Actual |
| 2023 | $75,370 | Actual |
| 2024 | $84,647 | Actual |
| 2025 | $78,125 | Actual |
| 2026(current) | $80,094 | Estimated |
| 2027 | $82,112 | Projected |
Based on 7 years of BLS OEWS data for the Woburn metropolitan area, the median plumber salary grew 15.7% from $67,545 (2019) to $78,125 (2025). At a 2.52% compound annual growth rate, salaries are projected to reach $82,112 by 2027 — a total increase of $14,567 (21.57%) from 2019.
Note: Historical values (2019–2025) are actual BLS OEWS figures for the Woburn metropolitan area, sourced from annual Occupational Employment and Wage Statistics surveys. 2026–2026 figures are current estimates, and 2027 values are projections, calculated using a 2.52% CAGR derived from 7-year BLS historical data. Actual salaries may vary based on employer, experience, certifications, and local market conditions.
Salary by Experience Level
| Experience | Estimated Salary Range |
|---|---|
| 0-2 years (New Graduate) | $58,212 – $62,378 |
| 3-5 years (Mid Career) | $62,378 – $80,094 |
| 5+ years (Experienced) | $80,094 – $102,520 |
| 10+ years (Top Earner) | $102,520 – $124,146 |
Plumber salary ranges estimated from BLS percentile data. Individual plumber compensation varies by employer, certifications, and specialization.
Plumber Job Market in Woburn
The local plumbing job market in Woburn has about ten active plumbers, which, while modest, reflects an ongoing demand for skilled services, especially in residential and commercial settings. The cost of living index is notably at 108.5, indicating that residents may face higher living expenses compared to the national average, thus influencing their overall purchasing power. Employers such as union plumbing contractors often provide the best salaries, but competitive offers can also come from large service companies like Roto-Rooter, as well as specialized roles in medical gas and industrial maintenance. The disparity in pay levels can be attributed to factors including union membership, the complexity of the job (e.g., medical gas versus standard residential work), and additional certifications. For aspiring plumbers in Woburn MA, gaining further credentials, specializing in high-demand areas, and considering union affiliation could be effective strategies for maximizing their earnings in this dynamic market.
More salary data for Woburn, MA:
Frequently Asked Questions
How much do plumbers make in Woburn, MA in 2026?
Is Woburn, MA a good place to work as a plumber?
Can plumbers make $100K in Woburn?
What is the cost-of-living adjusted plumber salary in Woburn?
How much does a plumber make per hour in Woburn?
Related Pages
Compare Salaries
Career Resources
Nearby Cities in Massachusetts
Written by Samuel Torres, CWP
Career Analyst
Samuel Torres has 10 years of experience in plumbing. He specializes in residential plumbing systems. He has worked with several home improvement companies.
Methodology & Data Source
Salary figures on this page are 2026 projections based on the Bureau of Labor Statistics Occupational Employment and Wage Statistics (OEWS) survey, May 2026 release. The BLS reported a median annual salary of $78,125 for plumbersin the Woburn metropolitan area. A 2.52% compound annual growth rate (CAGR), calculated from 6-year national BLS wage trends, was applied to project current 2026 compensation. Percentile ranges (P10–P90) represent the full salary distribution across experience levels and practice settings in this market.
Data Sources & Methodology
Salary data for Woburn is estimated from official BLS state-level occupational wage data (2025), adjusted for regional cost-of-living differences using BEA RPP (Regional Price Parities).
2026 figures are projected from 2025 BLS data using a compound annual growth rate (CAGR) of 2.52%, derived from historical BLS wage trends for plumbers (SOC 47-2152).
Compiled and verified by Samuel Torres, CWP, a licensed plumber with 10+ years of clinical experience. · View source data at BLS.gov