Plumber Salary in Holland, MI: $76,621 (2026)
Quick Answer:A full-time plumber in Holland, MI earns a median $76,621/year (≈ $36.84/hour) in nominal terms for 2026 — projected from BLS OEWS 2025 (SOC 47-2152). Once you factor in Holland's price level (7% below national, BEA RPP 93.2), that paycheck buys what $82,211 would nationally. Nominal pay sits 4.4% below the Michigan state average.
Based on BLS state-level estimates · View source
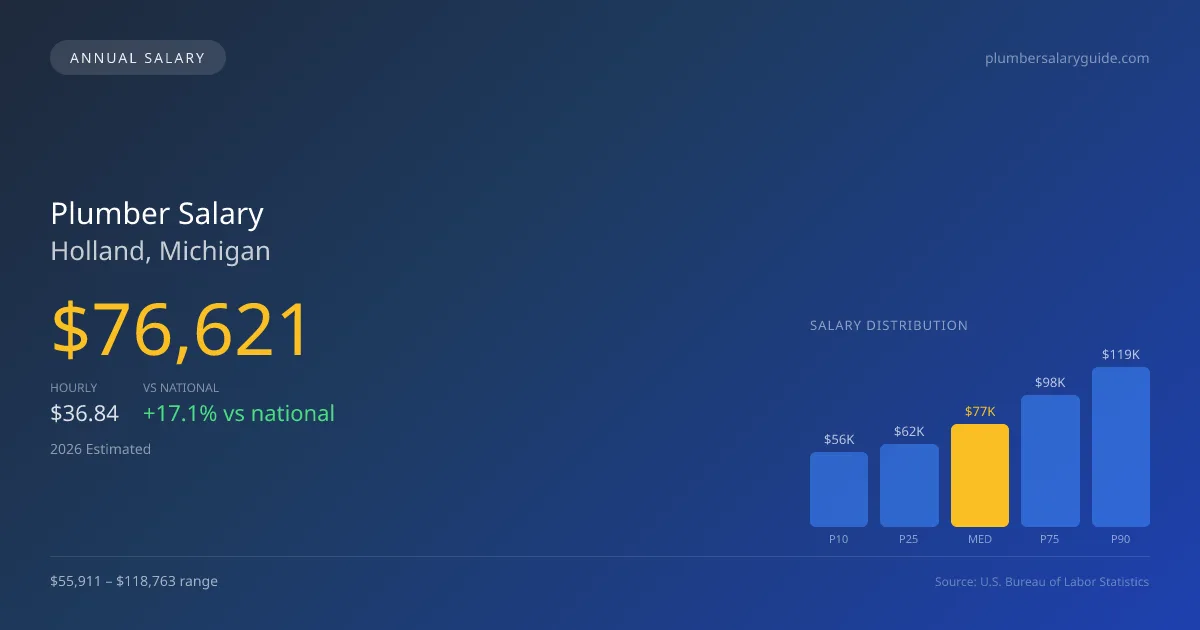
In Holland, Michigan, the projected median annual salary for plumbers in 2026 is $76,621, which is significantly higher than the national median of $65,408, marking a 17.14% increase. The salary range for this occupation spans from $55,911 at the 10th percentile to $118,763 at the 90th percentile, reflecting the variance in skills, experience, and employment settings. These estimates stem from BLS state-level data and regional price adjustments, illustrating the economic conditions in Holland. Notably, the local market is influenced heavily by the presence of union pipefitters, which tends to dominate compensation discussions, particularly given the premium wages associated with UA union jobs compared to non-union service plumbing positions.
About the Holland Market
Salary estimated from Michigan average ($70,000) adjusted for local cost of living.
Salary Breakdown
| Percentile | Annual | Hourly |
|---|---|---|
| Entry Level (P10) | $55,911 | $26.88 |
| Lower Range (P25) | $61,781 | $29.70 |
| Median (P50)(typical) | $76,621 | $36.84 |
| Upper Range (P75) | $98,076 | $47.15 |
| Top Earners (P90) | $118,763 | $57.09 |
Median Salary Position
17.14% above the national average
2026 Salary Percentile Distribution in Holland
In Holland, MI, the plumber salary spread from the 10th to 90th percentile is $62,852 (2026 est.). At $76,621, the local median is 17.14% above the national median of $65,408.
Salary Calculator
At 40 hours/week in Holland: You'd be in the lower-middle range
How Holland Plumber Pay Compares
Holland median: $76,621/year (2026)
| Compared To | Median Salary | Holland Pays |
|---|---|---|
| Michigan Average | $80,148 | -4.40% less |
| National Average | $65,408 | +17.14% more |
Plumbers in Holland, MI earn a median of $76,621 per year (2026 est.), which is 17.14% higher than the national median of $65,408 and 4.40% below the Michigan state average of $80,148.
Cost-of-Living Adjusted Salary
Holland has a cost of living 6.80% below the national average, meaning your salary goes further here.
Adjusted salary = nominal × (100 / CoL index). CoL index: 100 = national average.
Holland, MI has a cost-of-living index of 93.2 (below the national average of 100). A plumber earning $76,621 nominally has purchasing power equivalent to $82,211 in an average-cost city — an effective 7.3% boost.
Compare Purchasing Power
Select a city to see how your salary compares after cost of living
Select a city above to compare purchasing power
2019 BLS Actual
$64,617
2025 BLS Actual
$74,738
2026 Current Est.
$76,621
2019–2027 Growth
+21.6%
Salary Trajectory for Plumbers in Holland (2019–2027)
2019–2025: actual BLS OEWS data for this metro area. 2026+: CAGR 2.52% projection.
| Year | Annual Salary | Status |
|---|---|---|
| 2019 | $64,617 | Actual |
| 2020 | $65,987 | Actual |
| 2021 | $70,146 | Actual |
| 2022 | $70,392 | Actual |
| 2023 | $72,102 | Actual |
| 2024 | $62,344 | Actual |
| 2025 | $74,738 | Actual |
| 2026(current) | $76,621 | Estimated |
| 2027 | $78,552 | Projected |
Based on 7 years of BLS OEWS data for the Holland metropolitan area, the median plumber salary grew 15.7% from $64,617 (2019) to $74,738 (2025). At a 2.52% compound annual growth rate, salaries are projected to reach $78,552 by 2027 — a total increase of $13,935 (21.57%) from 2019.
Note: Historical values (2019–2025) are actual BLS OEWS figures for the Holland metropolitan area, sourced from annual Occupational Employment and Wage Statistics surveys. 2026–2026 figures are current estimates, and 2027 values are projections, calculated using a 2.52% CAGR derived from 7-year BLS historical data. Actual salaries may vary based on employer, experience, certifications, and local market conditions.
Salary by Experience Level
| Experience | Estimated Salary Range |
|---|---|
| 0-2 years (New Graduate) | $55,911 – $61,781 |
| 3-5 years (Mid Career) | $61,781 – $76,621 |
| 5+ years (Experienced) | $76,621 – $98,076 |
| 10+ years (Top Earner) | $98,076 – $118,763 |
Plumber salary ranges estimated from BLS percentile data. Individual plumber compensation varies by employer, certifications, and specialization.
Plumber Job Market in Holland
Focusing on the local job market, there are currently five plumbers employed in Holland, which indicates a specialized and possibly tight-knit community of professionals. With a cost-of-living index at 93.2, plumbers in this area can expect their take-home pay to stretch further than in regions with higher living expenses, enhancing their overall purchasing power. Among employers, the best pay generally comes from UA union contractors, whose benefits and compensation structures often outstrip those of non-union outfits and residential service companies. Fees can also vary based on specialty skills, such as medical gas or industrial pipefitting, which often demand higher wages. The wide salary gap frequently results from factors like union versus non-union status, additional licensure, field of expertise, and commission-based earnings in service roles. For plumbers in the area, obtaining additional certifications or pursuing union membership can be effective strategies to maximize earnings in the competitive Holland market.
More salary data for Holland, MI:
Frequently Asked Questions
How much do plumbers make in Holland, MI in 2026?
Is Holland, MI a good place to work as a plumber?
Can plumbers make $100K in Holland?
What is the cost-of-living adjusted plumber salary in Holland?
How much does a plumber make per hour in Holland?
Related Pages
Compare Salaries
Career Resources
Nearby Cities in Michigan
Written by Samuel Torres, CWP
Career Analyst
Samuel Torres has 10 years of experience in plumbing. He specializes in residential plumbing systems. He has worked with several home improvement companies.
Methodology & Data Source
Salary figures on this page are 2026 projections based on the Bureau of Labor Statistics Occupational Employment and Wage Statistics (OEWS) survey, May 2026 release. The BLS reported a median annual salary of $74,738 for plumbersin the Holland metropolitan area. A 2.52% compound annual growth rate (CAGR), calculated from 6-year national BLS wage trends, was applied to project current 2026 compensation. Percentile ranges (P10–P90) represent the full salary distribution across experience levels and practice settings in this market.
Data Sources & Methodology
Salary data for Holland is estimated from official BLS state-level occupational wage data (2025), adjusted for regional cost-of-living differences using BEA RPP (Regional Price Parities).
2026 figures are projected from 2025 BLS data using a compound annual growth rate (CAGR) of 2.52%, derived from historical BLS wage trends for plumbers (SOC 47-2152).
Compiled and verified by Samuel Torres, CWP, a licensed plumber with 10+ years of clinical experience. · View source data at BLS.gov