Plumber Salary in St. Cloud, MN: $92,504 (2026)
Quick Answer:A full-time plumber in St. Cloud, MN earns a median $92,504/year (≈ $44.47/hour) in nominal terms for 2026 — projected from BLS OEWS 2025 (SOC 47-2152). Once you factor in St. Cloud's price level (12% below national, BEA RPP 87.6), that paycheck buys what $105,560 would nationally. Nominal pay sits 6.1% above the Minnesota state average.
Official BLS data · View source
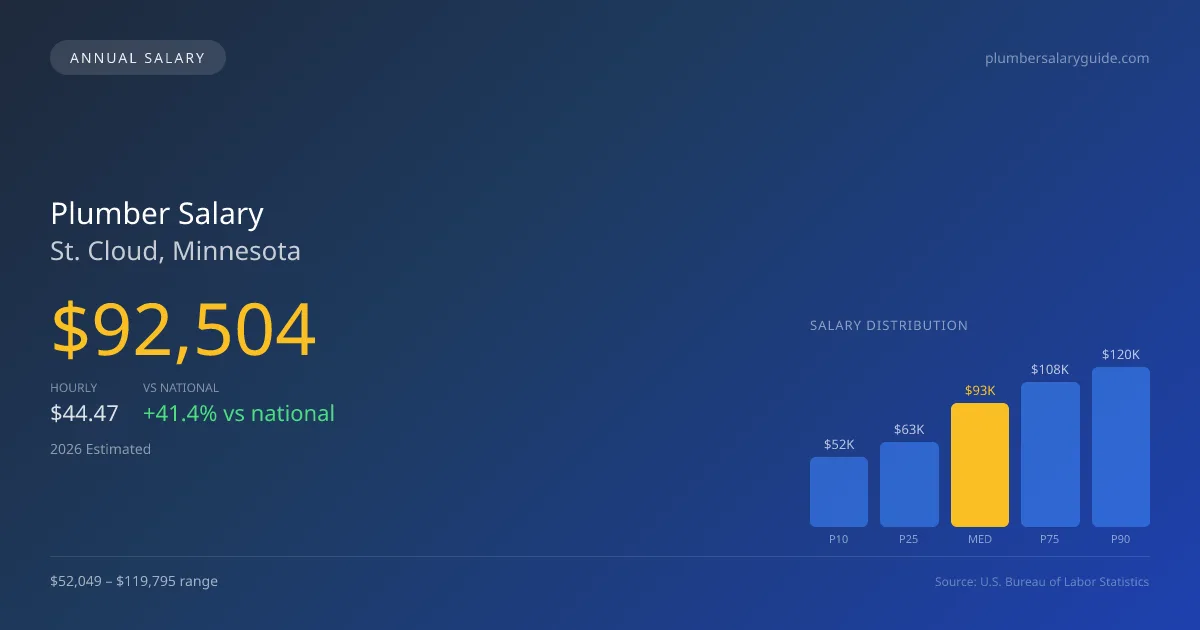
In 2026, plumbers in St. Cloud, Minnesota, are projected to earn a median annual salary of $92,504, significantly higher than the national median of $65,408, which reflects a 41.43% premium for local workers. The salary range for this occupation in the area spans from $52,049 at the lower tenth percentile to $119,795 at the ninetieth percentile. These insights, derived from official Bureau of Labor Statistics (BLS) Occupational Employment and Wage Statistics (OEWS), demonstrate a robust compensation structure. Specialty skills, including certifications in medical gas and industrial services, can greatly enhance earning potential, making St. Cloud's plumbing market particularly attractive as employers seek qualified professionals to address various infrastructural challenges.
Salary Breakdown
| Percentile | Annual | Hourly |
|---|---|---|
| Entry Level (P10) | $52,049 | $25.03 |
| Lower Range (P25) | $63,398 | $30.48 |
| Median (P50)(typical) | $92,504 | $44.47 |
| Upper Range (P75) | $108,261 | $52.05 |
| Top Earners (P90) | $119,795 | $57.60 |
Median Salary Position
41.43% above the national average
2026 Salary Percentile Distribution in St. Cloud
In St. Cloud, MN, the plumber salary spread from the 10th to 90th percentile is $67,746 (2026 est.). At $92,504, the local median is 41.43% above the national median of $65,408.
Salary Calculator
At 40 hours/week in St. Cloud: You'd be above the median
How St. Cloud Plumber Pay Compares
St. Cloud median: $92,504/year (2026)
| Compared To | Median Salary | St. Cloud Pays |
|---|---|---|
| Minnesota Average | $87,185 | +6.10% more |
| National Average | $65,408 | +41.43% more |
Plumbers in St. Cloud, MN earn a median of $92,504 per year (2026 est.), which is 41.43% higher than the national median of $65,408 and 6.10% above the Minnesota state average of $87,185.
Cost-of-Living Adjusted Salary
St. Cloud has a cost of living 12.37% below the national average, meaning your salary goes further here.
Adjusted salary = nominal × (100 / CoL index). CoL index: 100 = national average.
St. Cloud, MN has a cost-of-living index of 87.632 (below the national average of 100). A plumber earning $92,504 nominally has purchasing power equivalent to $105,560 in an average-cost city — an effective 14.11% boost.
Compare Purchasing Power
Select a city to see how your salary compares after cost of living
Select a city above to compare purchasing power
2019 BLS Actual
$66,080
2025 BLS Actual
$90,230
2026 Current Est.
$92,504
2019–2027 Growth
+43.5%
Salary Trajectory for Plumbers in St. Cloud (2019–2027)
2019–2025: actual BLS OEWS data for this metro area. 2026+: CAGR 2.52% projection.
| Year | Annual Salary | Status |
|---|---|---|
| 2019 | $66,080 | Actual |
| 2020 | $69,050 | Actual |
| 2021 | $75,710 | Actual |
| 2022 | $64,760 | Actual |
| 2023 | $78,730 | Actual |
| 2024 | $83,380 | Actual |
| 2025 | $90,230 | Actual |
| 2026(current) | $92,504 | Estimated |
| 2027 | $94,835 | Projected |
Based on 7 years of BLS OEWS data for the St. Cloud metropolitan area, the median plumber salary grew 36.5% from $66,080 (2019) to $90,230 (2025). At a 2.52% compound annual growth rate, salaries are projected to reach $94,835 by 2027 — a total increase of $28,755 (43.52%) from 2019.
Note: Historical values (2019–2025) are actual BLS OEWS figures for the St. Cloud metropolitan area, sourced from annual Occupational Employment and Wage Statistics surveys. 2026–2026 figures are current estimates, and 2027 values are projections, calculated using a 2.52% CAGR derived from 7-year BLS historical data. Actual salaries may vary based on employer, experience, certifications, and local market conditions.
Salary by Experience Level
| Experience | Estimated Salary Range |
|---|---|
| 0-2 years (New Graduate) | $52,049 – $63,398 |
| 3-5 years (Mid Career) | $63,398 – $92,504 |
| 5+ years (Experienced) | $92,504 – $108,261 |
| 10+ years (Top Earner) | $108,261 – $119,795 |
Plumber salary ranges estimated from BLS percentile data. Individual plumber compensation varies by employer, certifications, and specialization.
Plumber Job Market in St. Cloud
In St. Cloud, there are approximately 830 plumbers employed, indicating a vibrant local job market. The cost of living index stands at 87.632, which suggests that salaries may afford plumbers a more comfortable lifestyle compared to other regions. Among potential employers, union plumbing contractors affiliated with the United Association tend to offer higher compensation compared to non-union entities, reflecting a significant wage spread primarily due to differences in skillset and union benefits. The dynamics of plumber pay in St. Cloud, MN, often depend on factors such as specialty areas, licensing levels, and employment type. Master plumbers holding contractor licenses, particularly in high-skilled areas like medical gas or those in self-employed capacities, can command higher rates. To maximize earnings, professionals should consider pursuing advanced certifications and engaging in overtime opportunities, as these strategies can greatly enhance overall compensation in a competitive market.
More salary data for St. Cloud, MN:
Frequently Asked Questions
How much do plumbers make in St. Cloud, MN in 2026?
Is St. Cloud, MN a good place to work as a plumber?
Can plumbers make $100K in St. Cloud?
What is the cost-of-living adjusted plumber salary in St. Cloud?
How much does a plumber make per hour in St. Cloud?
Related Pages
Compare Salaries
Career Resources
Nearby Cities in Minnesota
Written by Samuel Torres, CWP
Career Analyst
Samuel Torres has 10 years of experience in plumbing. He specializes in residential plumbing systems. He has worked with several home improvement companies.
Methodology & Data Source
Salary figures on this page are 2026 projections based on the Bureau of Labor Statistics Occupational Employment and Wage Statistics (OEWS) survey, May 2026 release. The BLS reported a median annual salary of $90,230 for plumbersin the St. Cloud metropolitan area. A 2.52% compound annual growth rate (CAGR), calculated from 6-year national BLS wage trends, was applied to project current 2026 compensation. Percentile ranges (P10–P90) represent the full salary distribution across experience levels and practice settings in this market.
Data Sources & Methodology
Source: BLS, OEWS, 7-year dataset (–). Per-city data from annual BLS metropolitan area surveys.
2026 figures are projected from 2025 BLS data using a compound annual growth rate (CAGR) of 2.52%, derived from historical BLS wage trends for plumbers (SOC 47-2152).
Compiled and verified by Samuel Torres, CWP, a licensed plumber with 10+ years of clinical experience. · View source data at BLS.gov