Plumber Salary in Norfolk, NE: $55,737 (2026)
Quick Answer:A full-time plumber in Norfolk, NE earns a median $55,737/year (≈ $26.80/hour) in nominal terms for 2026 — projected from BLS OEWS 2025 (SOC 47-2152). Once you factor in Norfolk's price level (8% below national, BEA RPP 91.5), that paycheck buys what $60,915 would nationally. Nominal pay sits 6.9% below the Nebraska state average.
Based on BLS state-level estimates · View source
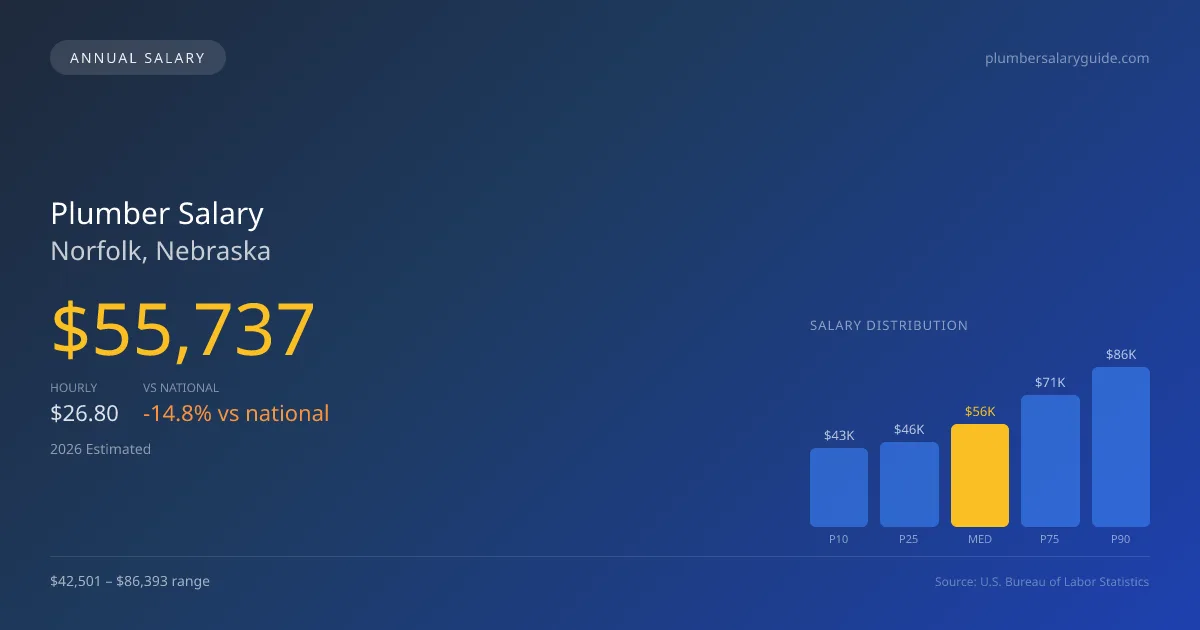
In 2026, a plumber salary in Norfolk, Nebraska, is projected to reach a median of $55,737. This figure highlights a significant pay gap between union pipefitters and non-union service plumbers, with the latter often earning less due to the competitive nature of the service market. Local estimates indicate a salary range from $42,501 at the 10th percentile to $86,393 at the 90th percentile. These projections are tailored from 2025 BLS state-level data and adjusted for regional cost variations, suggesting that compensation in Norfolk tends to lag behind the national median of $65,408 by nearly 14.79%. Within this context, plumbing employment remains robust, underscoring the ongoing demand for skilled labor in the area.
About the Norfolk Market
Salary estimated from Nebraska average ($58,000) adjusted for local cost of living.
Salary Breakdown
| Percentile | Annual | Hourly |
|---|---|---|
| Entry Level (P10) | $42,501 | $20.43 |
| Lower Range (P25) | $46,039 | $22.13 |
| Median (P50)(typical) | $55,737 | $26.80 |
| Upper Range (P75) | $71,344 | $34.30 |
| Top Earners (P90) | $86,393 | $41.53 |
Median Salary Position
14.79% below the national average
2026 Salary Percentile Distribution in Norfolk
In Norfolk, NE, the plumber salary spread from the 10th to 90th percentile is $43,892 (2026 est.). At $55,737, the local median is 14.79% below the national median of $65,408.
Salary Calculator
At 40 hours/week in Norfolk: You'd be in the lower-middle range
How Norfolk Plumber Pay Compares
Norfolk median: $55,737/year (2026)
| Compared To | Median Salary | Norfolk Pays |
|---|---|---|
| Nebraska Average | $59,868 | -6.90% less |
| National Average | $65,408 | -14.79% less |
Plumbers in Norfolk, NE earn a median of $55,737 per year (2026 est.), which is 14.79% lower than the national median of $65,408 and 6.90% below the Nebraska state average of $59,868.
Cost-of-Living Adjusted Salary
Norfolk has a cost of living 8.50% below the national average, meaning your salary goes further here.
Adjusted salary = nominal × (100 / CoL index). CoL index: 100 = national average.
Norfolk, NE has a cost-of-living index of 91.5 (below the national average of 100). A plumber earning $55,737 nominally has purchasing power equivalent to $60,915 in an average-cost city — an effective 9.29% boost.
Compare Purchasing Power
Select a city to see how your salary compares after cost of living
Select a city above to compare purchasing power
2019 BLS Actual
$47,004
2025 BLS Actual
$54,367
2026 Current Est.
$55,737
2019–2027 Growth
+21.6%
Salary Trajectory for Plumbers in Norfolk (2019–2027)
2019–2025: actual BLS OEWS data for this metro area. 2026+: CAGR 2.52% projection.
| Year | Annual Salary | Status |
|---|---|---|
| 2019 | $47,004 | Actual |
| 2020 | $48,001 | Actual |
| 2021 | $51,027 | Actual |
| 2022 | $51,206 | Actual |
| 2023 | $52,450 | Actual |
| 2024 | $49,425 | Actual |
| 2025 | $54,367 | Actual |
| 2026(current) | $55,737 | Estimated |
| 2027 | $57,142 | Projected |
Based on 7 years of BLS OEWS data for the Norfolk metropolitan area, the median plumber salary grew 15.7% from $47,004 (2019) to $54,367 (2025). At a 2.52% compound annual growth rate, salaries are projected to reach $57,142 by 2027 — a total increase of $10,138 (21.57%) from 2019.
Note: Historical values (2019–2025) are actual BLS OEWS figures for the Norfolk metropolitan area, sourced from annual Occupational Employment and Wage Statistics surveys. 2026–2026 figures are current estimates, and 2027 values are projections, calculated using a 2.52% CAGR derived from 7-year BLS historical data. Actual salaries may vary based on employer, experience, certifications, and local market conditions.
Salary by Experience Level
| Experience | Estimated Salary Range |
|---|---|
| 0-2 years (New Graduate) | $42,501 – $46,039 |
| 3-5 years (Mid Career) | $46,039 – $55,737 |
| 5+ years (Experienced) | $55,737 – $71,344 |
| 10+ years (Top Earner) | $71,344 – $86,393 |
Plumber salary ranges estimated from BLS percentile data. Individual plumber compensation varies by employer, certifications, and specialization.
Plumber Job Market in Norfolk
The local job market for plumbing shows that only six plumbers were employed in Norfolk, indicating a niche yet potentially stable environment. With a cost-of-living index of 91.5, the purchasing power for plumbers is somewhat better than the national average. Employers that offer the most competitive salaries typically include union plumbing contractors affiliated with the United Association and specialized industrial maintenance teams. In contrast, non-union service contractors and self-employed plumbers often see more variability in their earnings. Factors such as the premium pay for specialties like medical gas installation, master licensing, and the commission structure at large service companies heavily influence the salary spectrum. To maximize potential earnings in this market, plumbers should consider pursuing advanced certifications and licenses, as well as being open to opportunities with union contractors, which continue to offer substantial pay advantages compared to their non-union counterparts.
More salary data for Norfolk, NE:
Frequently Asked Questions
How much do plumbers make in Norfolk, NE in 2026?
Is Norfolk, NE a good place to work as a plumber?
Can plumbers make $100K in Norfolk?
What is the cost-of-living adjusted plumber salary in Norfolk?
How much does a plumber make per hour in Norfolk?
Related Pages
Compare Salaries
Career Resources
Nearby Cities in Nebraska
Written by Samuel Torres, CWP
Career Analyst
Samuel Torres has 10 years of experience in plumbing. He specializes in residential plumbing systems. He has worked with several home improvement companies.
Methodology & Data Source
Salary figures on this page are 2026 projections based on the Bureau of Labor Statistics Occupational Employment and Wage Statistics (OEWS) survey, May 2026 release. The BLS reported a median annual salary of $54,367 for plumbersin the Norfolk metropolitan area. A 2.52% compound annual growth rate (CAGR), calculated from 6-year national BLS wage trends, was applied to project current 2026 compensation. Percentile ranges (P10–P90) represent the full salary distribution across experience levels and practice settings in this market.
Data Sources & Methodology
Salary data for Norfolk is estimated from official BLS state-level occupational wage data (2025), adjusted for regional cost-of-living differences using BEA RPP (Regional Price Parities).
2026 figures are projected from 2025 BLS data using a compound annual growth rate (CAGR) of 2.52%, derived from historical BLS wage trends for plumbers (SOC 47-2152).
Compiled and verified by Samuel Torres, CWP, a licensed plumber with 10+ years of clinical experience. · View source data at BLS.gov