Plumber Salary in Merrimack, NH: $68,400 (2026)
Quick Answer:A full-time plumber in Merrimack, NH earns a median $68,400/year (≈ $32.89/hour) in nominal terms for 2026 — projected from BLS OEWS 2025 (SOC 47-2152). Once you factor in Merrimack's price level (7% above national, BEA RPP 107.3), that paycheck buys what $63,747 would nationally. Nominal pay sits 2.5% below the New Hampshire state average.
Based on BLS state-level estimates · View source
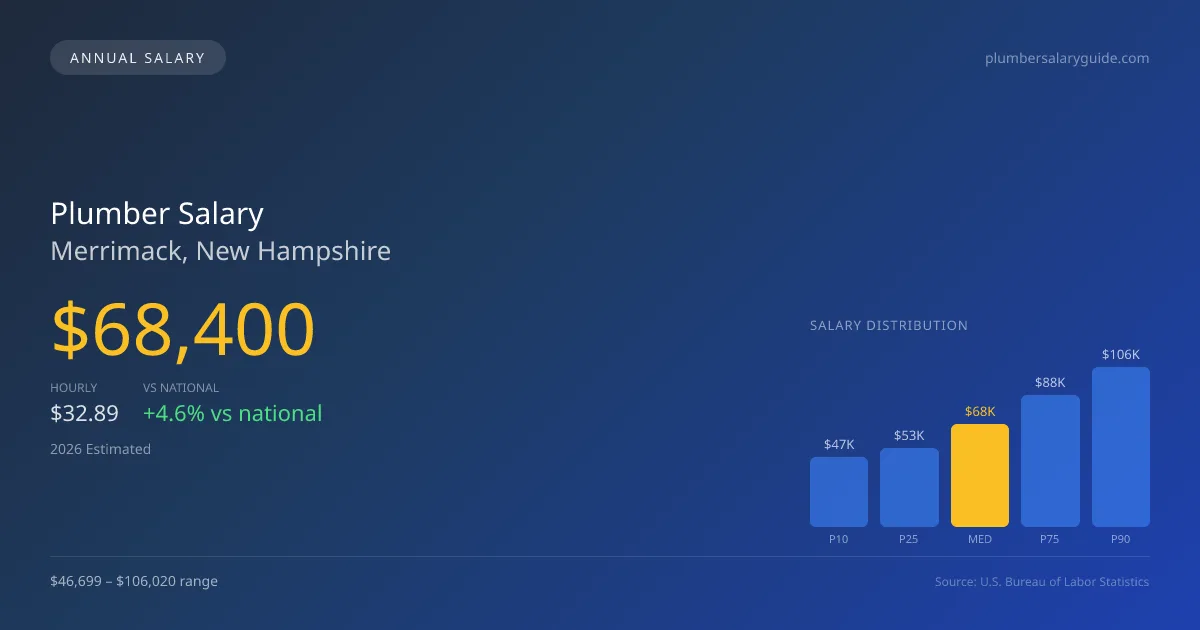
The projected median annual plumber salary in Merrimack, NH, for 2026 is $68,400, surpassing the national average of $65,408 by 4.57%. Plumbers in this area can expect to see a salary range from $46,699 at the 10th percentile to as much as $106,020 at the 90th percentile. These figures, which reflect local economic conditions and projected growth trends, are derived from 2025 BLS data, adjusted for regional price parities. For aspiring tradespeople considering a career in this sector, the balance between working as a self-employed contractor versus engaging with established service plumbing firms presents a pivotal choice that can impact earnings and job security in Merrimack's evolving market.
About the Merrimack Market
Salary estimated from New Hampshire average ($64,000) adjusted for local cost of living.
Salary Breakdown
| Percentile | Annual | Hourly |
|---|---|---|
| Entry Level (P10) | $46,699 | $22.45 |
| Lower Range (P25) | $52,618 | $25.30 |
| Median (P50)(typical) | $68,400 | $32.89 |
| Upper Range (P75) | $87,552 | $42.09 |
| Top Earners (P90) | $106,020 | $50.97 |
Median Salary Position
4.57% above the national average
2026 Salary Percentile Distribution in Merrimack
In Merrimack, NH, the plumber salary spread from the 10th to 90th percentile is $59,321 (2026 est.). At $68,400, the local median is 4.57% above the national median of $65,408.
Salary Calculator
At 40 hours/week in Merrimack: You'd be in the lower-middle range
How Merrimack Plumber Pay Compares
Merrimack median: $68,400/year (2026)
| Compared To | Median Salary | Merrimack Pays |
|---|---|---|
| New Hampshire Average | $70,154 | -2.50% less |
| National Average | $65,408 | +4.57% more |
Plumbers in Merrimack, NH earn a median of $68,400 per year (2026 est.), which is 4.57% higher than the national median of $65,408 and 2.50% below the New Hampshire state average of $70,154.
Cost-of-Living Adjusted Salary
Merrimack has a cost of living 7.30% above the national average.
Adjusted salary = nominal × (100 / CoL index). CoL index: 100 = national average.
Merrimack, NH has a cost-of-living index of 107.3 (above the national average of 100). While the nominal salary of $68,400 is competitive, the higher cost of living reduces purchasing power to an effective $63,747 — a 6.8% reduction.
Compare Purchasing Power
Select a city to see how your salary compares after cost of living
Select a city above to compare purchasing power
2019 BLS Actual
$57,684
2025 BLS Actual
$66,719
2026 Current Est.
$68,400
2019–2027 Growth
+21.6%
Salary Trajectory for Plumbers in Merrimack (2019–2027)
2019–2025: actual BLS OEWS data for this metro area. 2026+: CAGR 2.52% projection.
| Year | Annual Salary | Status |
|---|---|---|
| 2019 | $57,684 | Actual |
| 2020 | $58,907 | Actual |
| 2021 | $62,620 | Actual |
| 2022 | $62,839 | Actual |
| 2023 | $64,366 | Actual |
| 2024 | $66,929 | Actual |
| 2025 | $66,719 | Actual |
| 2026(current) | $68,400 | Estimated |
| 2027 | $70,124 | Projected |
Based on 7 years of BLS OEWS data for the Merrimack metropolitan area, the median plumber salary grew 15.7% from $57,684 (2019) to $66,719 (2025). At a 2.52% compound annual growth rate, salaries are projected to reach $70,124 by 2027 — a total increase of $12,440 (21.57%) from 2019.
Note: Historical values (2019–2025) are actual BLS OEWS figures for the Merrimack metropolitan area, sourced from annual Occupational Employment and Wage Statistics surveys. 2026–2026 figures are current estimates, and 2027 values are projections, calculated using a 2.52% CAGR derived from 7-year BLS historical data. Actual salaries may vary based on employer, experience, certifications, and local market conditions.
Salary by Experience Level
| Experience | Estimated Salary Range |
|---|---|
| 0-2 years (New Graduate) | $46,699 – $52,618 |
| 3-5 years (Mid Career) | $52,618 – $68,400 |
| 5+ years (Experienced) | $68,400 – $87,552 |
| 10+ years (Top Earner) | $87,552 – $106,020 |
Plumber salary ranges estimated from BLS percentile data. Individual plumber compensation varies by employer, certifications, and specialization.
Plumber Job Market in Merrimack
Despite the healthy median salary, the local job market features only a handful of employed plumbers—just five individuals in Merrimack currently. With a cost-of-living index standing at 107.3, which is above the national average, the purchasing power for plumbers must be carefully managed. Among local employers, union plumbing contractors typically offer the highest wages, often commanding premiums for skilled specialties like medical gas fitting or industrial maintenance. In contrast, non-union contractors or large service companies, such as Roto-Rooter, can offer commission-based incentives but may yield more variability in income. To enhance their earnings, plumbers in Merrimack might consider obtaining advanced certifications, pursuing union membership, or diversifying their skills to include high-demand specialties, especially given the rising demand due to an aging infrastructure and workforce.
More salary data for Merrimack, NH:
Frequently Asked Questions
How much do plumbers make in Merrimack, NH in 2026?
Is Merrimack, NH a good place to work as a plumber?
Can plumbers make $100K in Merrimack?
What is the cost-of-living adjusted plumber salary in Merrimack?
How much does a plumber make per hour in Merrimack?
Related Pages
Compare Salaries
Career Resources
Nearby Cities in New Hampshire
Written by Samuel Torres, CWP
Career Analyst
Samuel Torres has 10 years of experience in plumbing. He specializes in residential plumbing systems. He has worked with several home improvement companies.
Methodology & Data Source
Salary figures on this page are 2026 projections based on the Bureau of Labor Statistics Occupational Employment and Wage Statistics (OEWS) survey, May 2026 release. The BLS reported a median annual salary of $66,719 for plumbersin the Merrimack metropolitan area. A 2.52% compound annual growth rate (CAGR), calculated from 6-year national BLS wage trends, was applied to project current 2026 compensation. Percentile ranges (P10–P90) represent the full salary distribution across experience levels and practice settings in this market.
Data Sources & Methodology
Salary data for Merrimack is estimated from official BLS state-level occupational wage data (2025), adjusted for regional cost-of-living differences using BEA RPP (Regional Price Parities).
2026 figures are projected from 2025 BLS data using a compound annual growth rate (CAGR) of 2.52%, derived from historical BLS wage trends for plumbers (SOC 47-2152).
Compiled and verified by Samuel Torres, CWP, a licensed plumber with 10+ years of clinical experience. · View source data at BLS.gov