Plumber Salary in Bowling Green, OH: $64,156 (2026)
Quick Answer:A full-time plumber in Bowling Green, OH earns a median $64,156/year (≈ $30.85/hour) in nominal terms for 2026 — projected from BLS OEWS 2025 (SOC 47-2152). Once you factor in Bowling Green's price level (9% below national, BEA RPP 90.7), that paycheck buys what $70,734 would nationally. Nominal pay sits 0.6% below the Ohio state average.
Based on BLS state-level estimates · View source
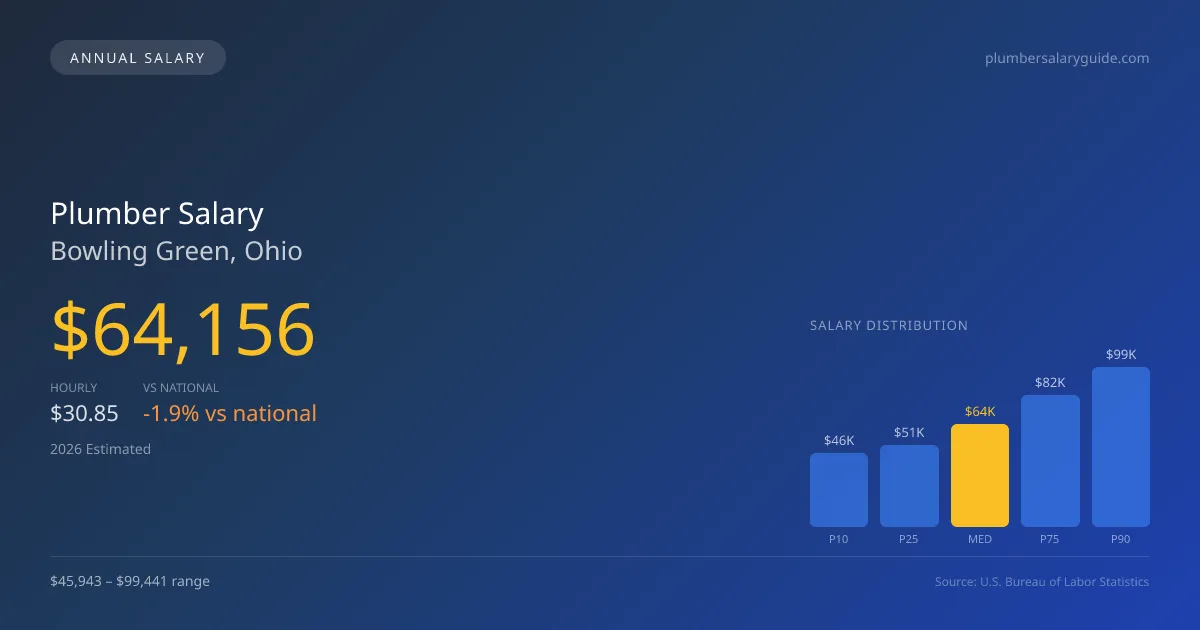
In 2026, the expected earnings for plumbers working in Bowling Green, Ohio, average around $64,156 annually. This figure reflects a competitive salary range that spans from $45,943 at the lower end (P10) up to $99,441 at the upper end (P90). These estimates, derived from 2025 BLS state-level data and adjusted for regional price parities, indicate a robust local market for plumbing services. With a split between self-employed contractors and employed tradespeople, those entering the plumbing field must consider the economic benefits and challenges of each path. The current job market in Bowling Green appears to have a steady demand for plumbing services, suggesting opportunities for growth in this sector.
About the Bowling Green Market
Salary estimated from Ohio average ($66,000) adjusted for local cost of living.
Salary Breakdown
| Percentile | Annual | Hourly |
|---|---|---|
| Entry Level (P10) | $45,943 | $22.09 |
| Lower Range (P25) | $50,885 | $24.46 |
| Median (P50)(typical) | $64,156 | $30.85 |
| Upper Range (P75) | $82,120 | $39.48 |
| Top Earners (P90) | $99,441 | $47.81 |
Median Salary Position
1.91% below the national average
2026 Salary Percentile Distribution in Bowling Green
In Bowling Green, OH, the plumber salary spread from the 10th to 90th percentile is $53,498 (2026 est.). At $64,156, the local median is 1.91% below the national median of $65,408.
Salary Calculator
At 40 hours/week in Bowling Green: You'd be in the lower-middle range
How Bowling Green Plumber Pay Compares
Bowling Green median: $64,156/year (2026)
| Compared To | Median Salary | Bowling Green Pays |
|---|---|---|
| Ohio Average | $64,543 | -0.60% less |
| National Average | $65,408 | -1.91% less |
Plumbers in Bowling Green, OH earn a median of $64,156 per year (2026 est.), which is 1.91% lower than the national median of $65,408 and 0.60% below the Ohio state average of $64,543.
Cost-of-Living Adjusted Salary
Bowling Green has a cost of living 9.30% below the national average, meaning your salary goes further here.
Adjusted salary = nominal × (100 / CoL index). CoL index: 100 = national average.
Bowling Green, OH has a cost-of-living index of 90.7 (below the national average of 100). A plumber earning $64,156 nominally has purchasing power equivalent to $70,734 in an average-cost city — an effective 10.25% boost.
Compare Purchasing Power
Select a city to see how your salary compares after cost of living
Select a city above to compare purchasing power
2019 BLS Actual
$54,104
2025 BLS Actual
$62,579
2026 Current Est.
$64,156
2019–2027 Growth
+21.6%
Salary Trajectory for Plumbers in Bowling Green (2019–2027)
2019–2025: actual BLS OEWS data for this metro area. 2026+: CAGR 2.52% projection.
| Year | Annual Salary | Status |
|---|---|---|
| 2019 | $54,104 | Actual |
| 2020 | $55,252 | Actual |
| 2021 | $58,734 | Actual |
| 2022 | $58,940 | Actual |
| 2023 | $60,372 | Actual |
| 2024 | $59,481 | Actual |
| 2025 | $62,579 | Actual |
| 2026(current) | $64,156 | Estimated |
| 2027 | $65,773 | Projected |
Based on 7 years of BLS OEWS data for the Bowling Green metropolitan area, the median plumber salary grew 15.7% from $54,104 (2019) to $62,579 (2025). At a 2.52% compound annual growth rate, salaries are projected to reach $65,773 by 2027 — a total increase of $11,669 (21.57%) from 2019.
Note: Historical values (2019–2025) are actual BLS OEWS figures for the Bowling Green metropolitan area, sourced from annual Occupational Employment and Wage Statistics surveys. 2026–2026 figures are current estimates, and 2027 values are projections, calculated using a 2.52% CAGR derived from 7-year BLS historical data. Actual salaries may vary based on employer, experience, certifications, and local market conditions.
Salary by Experience Level
| Experience | Estimated Salary Range |
|---|---|
| 0-2 years (New Graduate) | $45,943 – $50,885 |
| 3-5 years (Mid Career) | $50,885 – $64,156 |
| 5+ years (Experienced) | $64,156 – $82,120 |
| 10+ years (Top Earner) | $82,120 – $99,441 |
Plumber salary ranges estimated from BLS percentile data. Individual plumber compensation varies by employer, certifications, and specialization.
Plumber Job Market in Bowling Green
Looking deeper into the plumbing job landscape, only seven plumbers are currently employed in Bowling Green. With a cost of living index sitting at 90.7, the affordability in this area means that plumber pay in Bowling Green OH can stretch further than in many other regions. Local employers include society contractors and sizable service firms like Roto-Rooter, which often pay the most competitive wages, especially for plumbers holding valuable specialties like medical gas certification or those who are unionized. The salary discrepancies here are significant, driven by factors such as union versus non-union positions, the complexity of projects, and additional licenses that allow for higher earning potential. For those seeking to increase their plumber salary in Bowling Green, pursuing union membership, obtaining advanced certifications, and gaining experience in high-demand specialties could prove to be beneficial strategies.
More salary data for Bowling Green, OH:
Frequently Asked Questions
How much do plumbers make in Bowling Green, OH in 2026?
Is Bowling Green, OH a good place to work as a plumber?
Can plumbers make $100K in Bowling Green?
What is the cost-of-living adjusted plumber salary in Bowling Green?
How much does a plumber make per hour in Bowling Green?
Related Pages
Compare Salaries
Career Resources
Nearby Cities in Ohio
Written by Samuel Torres, CWP
Career Analyst
Samuel Torres has 10 years of experience in plumbing. He specializes in residential plumbing systems. He has worked with several home improvement companies.
Methodology & Data Source
Salary figures on this page are 2026 projections based on the Bureau of Labor Statistics Occupational Employment and Wage Statistics (OEWS) survey, May 2026 release. The BLS reported a median annual salary of $62,579 for plumbersin the Bowling Green metropolitan area. A 2.52% compound annual growth rate (CAGR), calculated from 6-year national BLS wage trends, was applied to project current 2026 compensation. Percentile ranges (P10–P90) represent the full salary distribution across experience levels and practice settings in this market.
Data Sources & Methodology
Salary data for Bowling Green is estimated from official BLS state-level occupational wage data (2025), adjusted for regional cost-of-living differences using BEA RPP (Regional Price Parities).
2026 figures are projected from 2025 BLS data using a compound annual growth rate (CAGR) of 2.52%, derived from historical BLS wage trends for plumbers (SOC 47-2152).
Compiled and verified by Samuel Torres, CWP, a licensed plumber with 10+ years of clinical experience. · View source data at BLS.gov