Plumber Salary in West Warwick, RI: $64,984 (2026)
Quick Answer:A full-time plumber in West Warwick, RI earns a median $64,984/year (≈ $31.24/hour) in nominal terms for 2026 — projected from BLS OEWS 2025 (SOC 47-2152). Once you factor in West Warwick's price level (1% above national, BEA RPP 100.5), that paycheck buys what $64,661 would nationally. Nominal pay sits 1.1% below the Rhode Island state average.
Based on BLS state-level estimates · View source
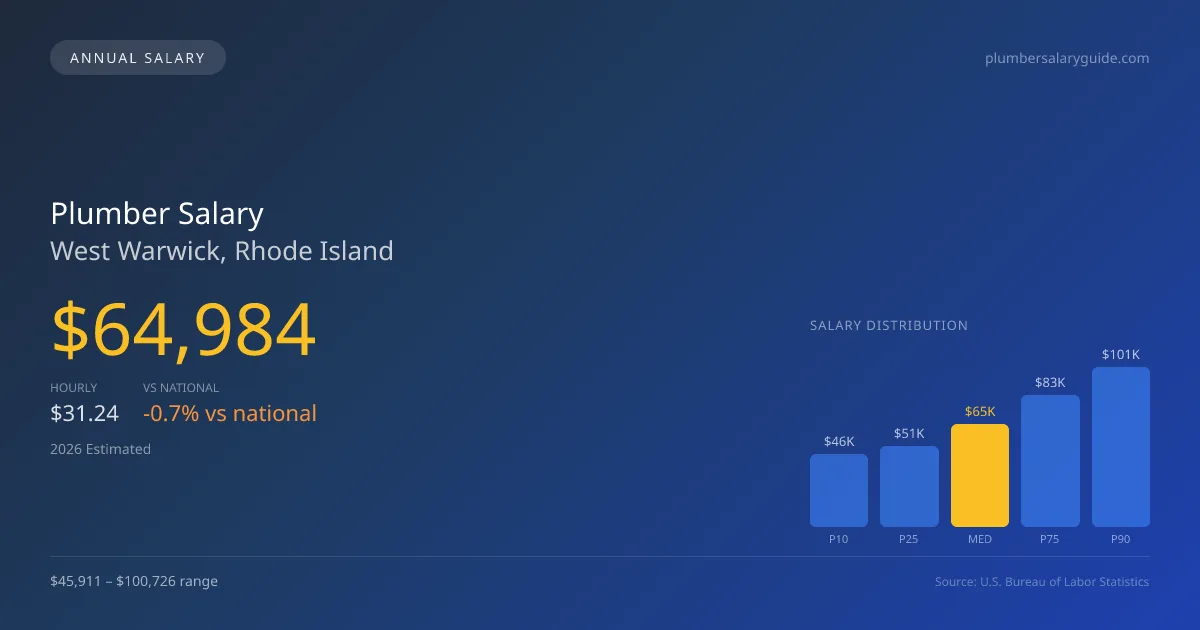
In 2026, plumbers in West Warwick, Rhode Island can expect a median annual salary of $64,984, which sits just slightly below the national median of $65,408. Salary ranges reflect a diverse market, with entry-level positions earning around $45,911 (P10) and highly experienced plumbers reaching up to $100,726 (P90). These estimates derive from local BLS state-level data and regional price adjustments, highlighting the unique economic landscape of West Warwick, which includes a growing emphasis on specialty trades such as medical gas certification and industrial plumbing. Job opportunities in the area cater to various skill levels, ensuring that dedicated plumbers can find roles that align with their expertise and ambitions.
About the West Warwick Market
Salary estimated from Rhode Island average ($66,000) adjusted for local cost of living.
Salary Breakdown
| Percentile | Annual | Hourly |
|---|---|---|
| Entry Level (P10) | $45,911 | $22.07 |
| Lower Range (P25) | $51,130 | $24.58 |
| Median (P50)(typical) | $64,984 | $31.24 |
| Upper Range (P75) | $83,180 | $39.99 |
| Top Earners (P90) | $100,726 | $48.43 |
Median Salary Position
0.65% below the national average
2026 Salary Percentile Distribution in West Warwick
In West Warwick, RI, the plumber salary spread from the 10th to 90th percentile is $54,815 (2026 est.). At $64,984, the local median is 0.65% below the national median of $65,408.
Salary Calculator
At 40 hours/week in West Warwick: You'd be in the lower-middle range
How West Warwick Plumber Pay Compares
West Warwick median: $64,984/year (2026)
| Compared To | Median Salary | West Warwick Pays |
|---|---|---|
| Rhode Island Average | $65,707 | -1.10% less |
| National Average | $65,408 | -0.65% less |
Plumbers in West Warwick, RI earn a median of $64,984 per year (2026 est.), which is 0.65% lower than the national median of $65,408 and 1.10% below the Rhode Island state average of $65,707.
Cost-of-Living Adjusted Salary
West Warwick has a cost of living 0.50% above the national average.
Adjusted salary = nominal × (100 / CoL index). CoL index: 100 = national average.
West Warwick, RI has a cost-of-living index of 100.5 (above the national average of 100). While the nominal salary of $64,984 is competitive, the higher cost of living reduces purchasing power to an effective $64,661 — a 0.5% reduction.
Compare Purchasing Power
Select a city to see how your salary compares after cost of living
Select a city above to compare purchasing power
2019 BLS Actual
$54,803
2025 BLS Actual
$63,387
2026 Current Est.
$64,984
2019–2027 Growth
+21.6%
Salary Trajectory for Plumbers in West Warwick (2019–2027)
2019–2025: actual BLS OEWS data for this metro area. 2026+: CAGR 2.52% projection.
| Year | Annual Salary | Status |
|---|---|---|
| 2019 | $54,803 | Actual |
| 2020 | $55,965 | Actual |
| 2021 | $59,492 | Actual |
| 2022 | $59,701 | Actual |
| 2023 | $61,152 | Actual |
| 2024 | $65,573 | Actual |
| 2025 | $63,387 | Actual |
| 2026(current) | $64,984 | Estimated |
| 2027 | $66,622 | Projected |
Based on 7 years of BLS OEWS data for the West Warwick metropolitan area, the median plumber salary grew 15.7% from $54,803 (2019) to $63,387 (2025). At a 2.52% compound annual growth rate, salaries are projected to reach $66,622 by 2027 — a total increase of $11,819 (21.57%) from 2019.
Note: Historical values (2019–2025) are actual BLS OEWS figures for the West Warwick metropolitan area, sourced from annual Occupational Employment and Wage Statistics surveys. 2026–2026 figures are current estimates, and 2027 values are projections, calculated using a 2.52% CAGR derived from 7-year BLS historical data. Actual salaries may vary based on employer, experience, certifications, and local market conditions.
Salary by Experience Level
| Experience | Estimated Salary Range |
|---|---|
| 0-2 years (New Graduate) | $45,911 – $51,130 |
| 3-5 years (Mid Career) | $51,130 – $64,984 |
| 5+ years (Experienced) | $64,984 – $83,180 |
| 10+ years (Top Earner) | $83,180 – $100,726 |
Plumber salary ranges estimated from BLS percentile data. Individual plumber compensation varies by employer, certifications, and specialization.
Plumber Job Market in West Warwick
Locally, the job market consists of just seven plumbers, indicating a tight-knit community of professionals. The cost of living index in West Warwick is slightly above the national average at 100.5, which impacts take-home pay and purchasing power. Among employers, union plumbing contractors, particularly those affiliated with the UA (United Association), typically offer the highest wages compared to non-union service contractors, industrial maintenance companies, and self-employed plumbers. The wide salary range reflects the influence of various factors, such as the specific plumbing specialty, union affiliation, and even the degree of experience, with union positions commanding 30-50% premiums over non-union counterparts. For those seeking to improve their earning potential in this market, pursuing additional certifications such as medical gas or backflow prevention, gaining experience in commercial or industrial settings, and staying abreast of market demands will be crucial strategies.
More salary data for West Warwick, RI:
Frequently Asked Questions
How much do plumbers make in West Warwick, RI in 2026?
Is West Warwick, RI a good place to work as a plumber?
Can plumbers make $100K in West Warwick?
What is the cost-of-living adjusted plumber salary in West Warwick?
How much does a plumber make per hour in West Warwick?
Related Pages
Compare Salaries
Career Resources
Nearby Cities in Rhode Island
Written by Samuel Torres, CWP
Career Analyst
Samuel Torres has 10 years of experience in plumbing. He specializes in residential plumbing systems. He has worked with several home improvement companies.
Methodology & Data Source
Salary figures on this page are 2026 projections based on the Bureau of Labor Statistics Occupational Employment and Wage Statistics (OEWS) survey, May 2026 release. The BLS reported a median annual salary of $63,387 for plumbersin the West Warwick metropolitan area. A 2.52% compound annual growth rate (CAGR), calculated from 6-year national BLS wage trends, was applied to project current 2026 compensation. Percentile ranges (P10–P90) represent the full salary distribution across experience levels and practice settings in this market.
Data Sources & Methodology
Salary data for West Warwick is estimated from official BLS state-level occupational wage data (2025), adjusted for regional cost-of-living differences using BEA RPP (Regional Price Parities).
2026 figures are projected from 2025 BLS data using a compound annual growth rate (CAGR) of 2.52%, derived from historical BLS wage trends for plumbers (SOC 47-2152).
Compiled and verified by Samuel Torres, CWP, a licensed plumber with 10+ years of clinical experience. · View source data at BLS.gov