Plumber Salary in Colchester, VT: $62,665 (2026)
Quick Answer:A full-time plumber in Colchester, VT earns a median $62,665/year (≈ $30.13/hour) in nominal terms for 2026 — projected from BLS OEWS 2025 (SOC 47-2152). Once you factor in Colchester's price level (4% above national, BEA RPP 103.5), that paycheck buys what $60,546 would nationally. Nominal pay sits 7.4% below the Vermont state average.
Based on BLS state-level estimates · View source
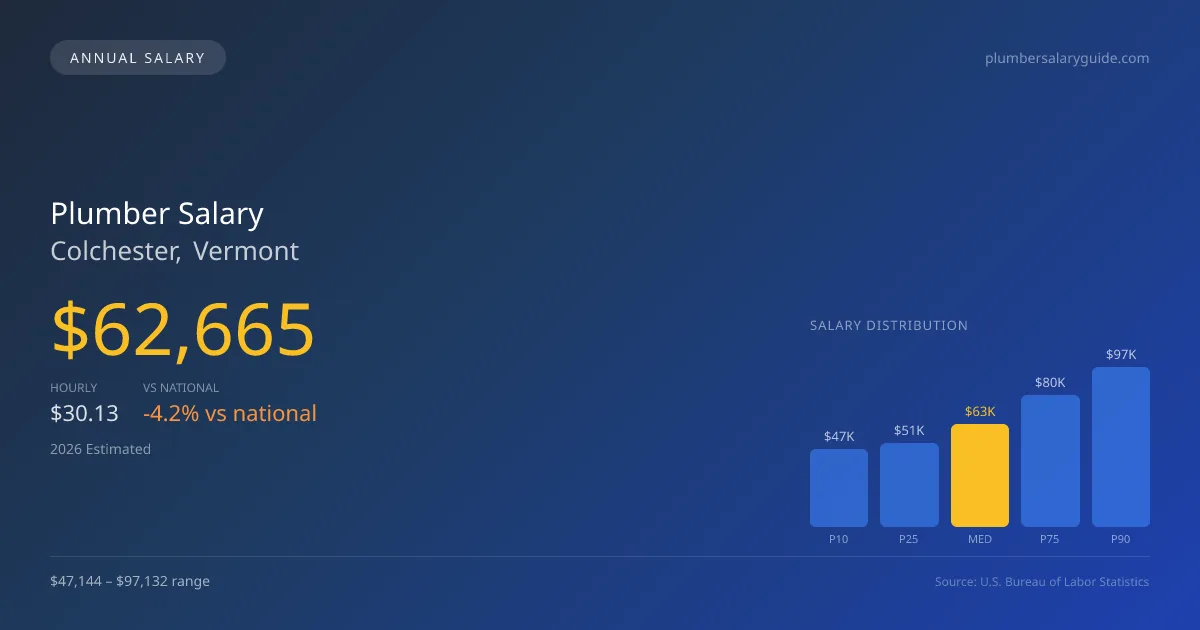
In Colchester, Vermont, plumbers can expect a median annual salary of $62,665, which reflects a slight undervalue compared to the national median of $65,408. The salary landscape ranges significantly from $47,144 at the lower end (P10) to $97,132 at the upper end (P90), indicating a diverse market driven by various factors. These figures are derived from 2025 BLS OEWS data and adjusted for local economic conditions. The local market dynamics provide opportunities for both employed plumbers and self-employed contractors, with the latter potentially enjoying higher margins, albeit with the risks and uncertainties inherent in running a business. As Colchester continues to grow, the demand for plumbing professionals is poised to rise, influenced by the aging infrastructure and the current workforce nearing retirement age.
About the Colchester Market
Salary estimated from Vermont average ($62,000) adjusted for local cost of living.
Salary Breakdown
| Percentile | Annual | Hourly |
|---|---|---|
| Entry Level (P10) | $47,144 | $22.67 |
| Lower Range (P25) | $51,296 | $24.67 |
| Median (P50)(typical) | $62,665 | $30.13 |
| Upper Range (P75) | $80,212 | $38.57 |
| Top Earners (P90) | $97,132 | $46.70 |
Median Salary Position
4.19% below the national average
2026 Salary Percentile Distribution in Colchester
In Colchester, VT, the plumber salary spread from the 10th to 90th percentile is $49,988 (2026 est.). At $62,665, the local median is 4.19% below the national median of $65,408.
Salary Calculator
At 40 hours/week in Colchester: You'd be in the lower-middle range
How Colchester Plumber Pay Compares
Colchester median: $62,665/year (2026)
| Compared To | Median Salary | Colchester Pays |
|---|---|---|
| Vermont Average | $67,673 | -7.40% less |
| National Average | $65,408 | -4.19% less |
Plumbers in Colchester, VT earn a median of $62,665 per year (2026 est.), which is 4.19% lower than the national median of $65,408 and 7.40% below the Vermont state average of $67,673.
Cost-of-Living Adjusted Salary
Colchester has a cost of living 3.50% above the national average.
Adjusted salary = nominal × (100 / CoL index). CoL index: 100 = national average.
Colchester, VT has a cost-of-living index of 103.5 (above the national average of 100). While the nominal salary of $62,665 is competitive, the higher cost of living reduces purchasing power to an effective $60,546 — a 3.38% reduction.
Compare Purchasing Power
Select a city to see how your salary compares after cost of living
Select a city above to compare purchasing power
2019 BLS Actual
$52,847
2025 BLS Actual
$61,125
2026 Current Est.
$62,665
2019–2027 Growth
+21.6%
Salary Trajectory for Plumbers in Colchester (2019–2027)
2019–2025: actual BLS OEWS data for this metro area. 2026+: CAGR 2.52% projection.
| Year | Annual Salary | Status |
|---|---|---|
| 2019 | $52,847 | Actual |
| 2020 | $53,968 | Actual |
| 2021 | $57,369 | Actual |
| 2022 | $57,571 | Actual |
| 2023 | $58,969 | Actual |
| 2024 | $59,401 | Actual |
| 2025 | $61,125 | Actual |
| 2026(current) | $62,665 | Estimated |
| 2027 | $64,245 | Projected |
Based on 7 years of BLS OEWS data for the Colchester metropolitan area, the median plumber salary grew 15.7% from $52,847 (2019) to $61,125 (2025). At a 2.52% compound annual growth rate, salaries are projected to reach $64,245 by 2027 — a total increase of $11,398 (21.57%) from 2019.
Note: Historical values (2019–2025) are actual BLS OEWS figures for the Colchester metropolitan area, sourced from annual Occupational Employment and Wage Statistics surveys. 2026–2026 figures are current estimates, and 2027 values are projections, calculated using a 2.52% CAGR derived from 7-year BLS historical data. Actual salaries may vary based on employer, experience, certifications, and local market conditions.
Salary by Experience Level
| Experience | Estimated Salary Range |
|---|---|
| 0-2 years (New Graduate) | $47,144 – $51,296 |
| 3-5 years (Mid Career) | $51,296 – $62,665 |
| 5+ years (Experienced) | $62,665 – $80,212 |
| 10+ years (Top Earner) | $80,212 – $97,132 |
Plumber salary ranges estimated from BLS percentile data. Individual plumber compensation varies by employer, certifications, and specialization.
Plumber Job Market in Colchester
Currently, the job market for plumbers in Colchester appears focused but limited, with only four plumbers employed locally. The cost of living index stands at 103.5, which suggests that take-home pay may not stretch as far when compared to national averages. Among local employers, union plumbing contractors and government utilities are likely to offer the highest compensation packages due to the established pay scales available to UA members, whereas non-union and self-employed plumbers can fluctuate significantly in earnings based on specialty skills like medical gas installation or commercial contracts. Factors leading to the broad salary range include the distinct differences in wages between union pipefitters, who often earn 30-50% more, and residential service plumbers backed by commissions. Plumbers aiming for higher pay should focus on obtaining specialized licenses and consider diversifying their skills to include high-demand services in both industrial and healthcare environments.
More salary data for Colchester, VT:
Frequently Asked Questions
How much do plumbers make in Colchester, VT in 2026?
Is Colchester, VT a good place to work as a plumber?
Can plumbers make $100K in Colchester?
What is the cost-of-living adjusted plumber salary in Colchester?
How much does a plumber make per hour in Colchester?
Related Pages
Compare Salaries
Career Resources
Nearby Cities in Vermont
Written by Samuel Torres, CWP
Career Analyst
Samuel Torres has 10 years of experience in plumbing. He specializes in residential plumbing systems. He has worked with several home improvement companies.
Methodology & Data Source
Salary figures on this page are 2026 projections based on the Bureau of Labor Statistics Occupational Employment and Wage Statistics (OEWS) survey, May 2026 release. The BLS reported a median annual salary of $61,125 for plumbersin the Colchester metropolitan area. A 2.52% compound annual growth rate (CAGR), calculated from 6-year national BLS wage trends, was applied to project current 2026 compensation. Percentile ranges (P10–P90) represent the full salary distribution across experience levels and practice settings in this market.
Data Sources & Methodology
Salary data for Colchester is estimated from official BLS state-level occupational wage data (2025), adjusted for regional cost-of-living differences using BEA RPP (Regional Price Parities).
2026 figures are projected from 2025 BLS data using a compound annual growth rate (CAGR) of 2.52%, derived from historical BLS wage trends for plumbers (SOC 47-2152).
Compiled and verified by Samuel Torres, CWP, a licensed plumber with 10+ years of clinical experience. · View source data at BLS.gov