Plumber Salary in Rutland, VT: $62,737 (2026)
Quick Answer:A full-time plumber in Rutland, VT earns a median $62,737/year (≈ $30.16/hour) in nominal terms for 2026 — projected from BLS OEWS 2025 (SOC 47-2152). Once you factor in Rutland's price level (4% above national, BEA RPP 103.5), that paycheck buys what $60,615 would nationally. Nominal pay sits 7.3% below the Vermont state average.
Based on BLS state-level estimates · View source
In 2026, the projected median annual salary for plumbers in Rutland, VT, is $62,737. This figure is slightly below the national median of $65,408, reflecting local market conditions influenced by factors such as demand and cost of living. The salary range for plumbers in the area spans from $47,591 at the 10th percentile to $97,242 at the 90th percentile, illustrating the diverse opportunities available within the trade. These estimates are derived from 2025 BLS state-level data and adjusted for regional price parity, indicating a challenging yet viable market for plumbing professionals. The self-employed contractors in Rutland are faced with a distinct economic reality compared to those employed by companies in the service plumbing sector, where stability and benefits are often prioritized over potentially higher self-employed earnings.
About the Rutland Market
Salary estimated from Vermont average ($62,000) adjusted for local cost of living.
Salary Breakdown
| Percentile | Annual | Hourly |
|---|---|---|
| Entry Level (P10) | $47,591 | $22.88 |
| Lower Range (P25) | $51,441 | $24.73 |
| Median (P50)(typical) | $62,737 | $30.16 |
| Upper Range (P75) | $80,304 | $38.61 |
| Top Earners (P90) | $97,242 | $46.75 |
Median Salary Position
4.08% below the national average
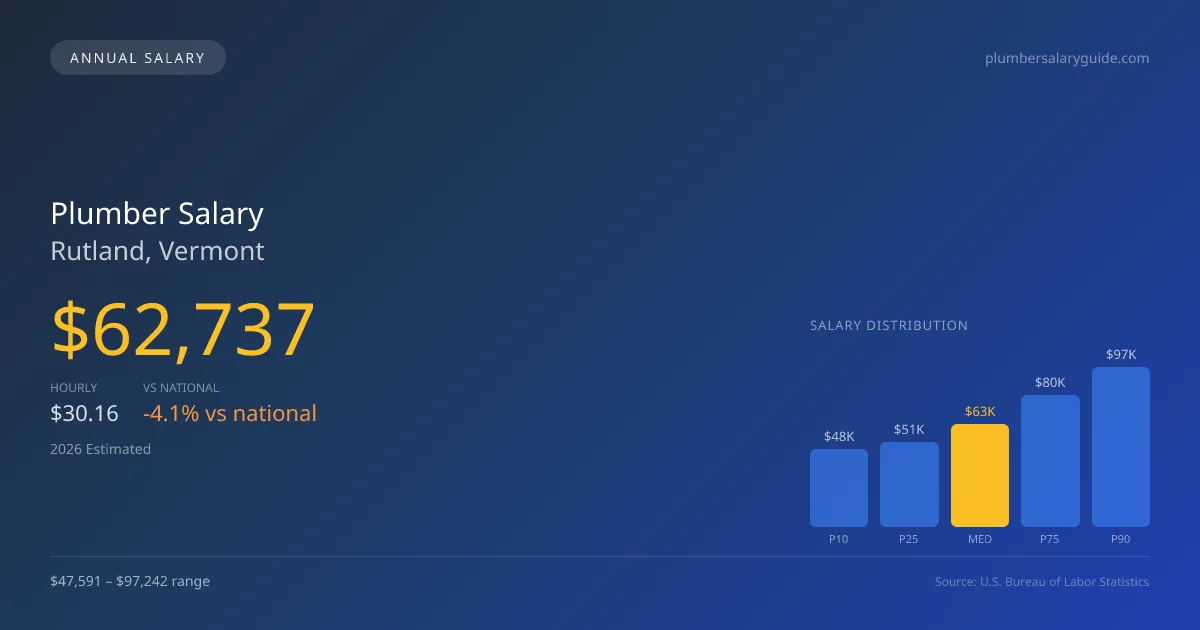
2026 Salary Percentile Distribution in Rutland
In Rutland, VT, the plumber salary spread from the 10th to 90th percentile is $49,651 (2026 est.). At $62,737, the local median is 4.08% below the national median of $65,408.
Salary Calculator
At 40 hours/week in Rutland: You'd be in the lower-middle range
How Rutland Plumber Pay Compares
Rutland median: $62,737/year (2026)
| Compared To | Median Salary | Rutland Pays |
|---|---|---|
| Vermont Average | $67,678 | -7.30% less |
| National Average | $65,408 | -4.08% less |
Plumbers in Rutland, VT earn a median of $62,737 per year (2026 est.), which is 4.08% lower than the national median of $65,408 and 7.30% below the Vermont state average of $67,678.
Cost-of-Living Adjusted Salary
Rutland has a cost of living 3.50% above the national average.
Adjusted salary = nominal × (100 / CoL index). CoL index: 100 = national average.
Rutland, VT has a cost-of-living index of 103.5 (above the national average of 100). While the nominal salary of $62,737 is competitive, the higher cost of living reduces purchasing power to an effective $60,615 — a 3.38% reduction.
Compare Purchasing Power
Select a city to see how your salary compares after cost of living
Select a city above to compare purchasing power
2019 BLS Actual
$52,908
2025 BLS Actual
$61,195
2026 Current Est.
$62,737
2019–2027 Growth
+21.6%
Salary Trajectory for Plumbers in Rutland (2019–2027)
2019–2025: actual BLS OEWS data for this metro area. 2026+: CAGR 2.52% projection.
| Year | Annual Salary | Status |
|---|---|---|
| 2019 | $52,908 | Actual |
| 2020 | $54,030 | Actual |
| 2021 | $57,435 | Actual |
| 2022 | $57,636 | Actual |
| 2023 | $59,037 | Actual |
| 2024 | $59,468 | Actual |
| 2025 | $61,195 | Actual |
| 2026(current) | $62,737 | Estimated |
| 2027 | $64,318 | Projected |
Based on 7 years of BLS OEWS data for the Rutland metropolitan area, the median plumber salary grew 15.7% from $52,908 (2019) to $61,195 (2025). At a 2.52% compound annual growth rate, salaries are projected to reach $64,318 by 2027 — a total increase of $11,410 (21.57%) from 2019.
Note: Historical values (2019–2025) are actual BLS OEWS figures for the Rutland metropolitan area, sourced from annual Occupational Employment and Wage Statistics surveys. 2026–2026 figures are current estimates, and 2027 values are projections, calculated using a 2.52% CAGR derived from 7-year BLS historical data. Actual salaries may vary based on employer, experience, certifications, and local market conditions.
Salary by Experience Level
| Experience | Estimated Salary Range |
|---|---|
| 0-2 years (New Graduate) | $47,591 – $51,441 |
| 3-5 years (Mid Career) | $51,441 – $62,737 |
| 5+ years (Experienced) | $62,737 – $80,304 |
| 10+ years (Top Earner) | $80,304 – $97,242 |
Plumber salary ranges estimated from BLS percentile data. Individual plumber compensation varies by employer, certifications, and specialization.
Plumber Job Market in Rutland
Despite having only four plumbers currently employed in Rutland, the local job market reflects ongoing demand within the trade, particularly as the workforce ages and infrastructure needs continue to grow. With a cost-of-living index at 103.5, plumbers need to be vigilant about their take-home pay to ensure it keeps pace with rising expenses. Opportunities often arise from various sectors, with union plumbing contractors typically offering the highest pay rates compared to non-union and self-employed plumbers. Those pursuing specialized skills such as medical gas certification or backflow prevention can enhance their marketability and increase earning potential significantly. To maximize pay in Rutland's plumbing market, professionals should consider obtaining master and contractor licenses, as well as exploring commission-based roles with larger service companies, which can provide lucrative overtime and commission opportunities in addition to base pay.
More salary data for Rutland, VT:
Frequently Asked Questions
How much do plumbers make in Rutland, VT in 2026?
Is Rutland, VT a good place to work as a plumber?
Can plumbers make $100K in Rutland?
What is the cost-of-living adjusted plumber salary in Rutland?
How much does a plumber make per hour in Rutland?
Related Pages
Compare Salaries
Career Resources
Nearby Cities in Vermont
Written by Samuel Torres, CWP
Career Analyst
Samuel Torres has 10 years of experience in plumbing. He specializes in residential plumbing systems. He has worked with several home improvement companies.
Methodology & Data Source
Salary figures on this page are 2026 projections based on the Bureau of Labor Statistics Occupational Employment and Wage Statistics (OEWS) survey, May 2026 release. The BLS reported a median annual salary of $61,195 for plumbersin the Rutland metropolitan area. A 2.52% compound annual growth rate (CAGR), calculated from 6-year national BLS wage trends, was applied to project current 2026 compensation. Percentile ranges (P10–P90) represent the full salary distribution across experience levels and practice settings in this market.
Data Sources & Methodology
Salary data for Rutland is estimated from official BLS state-level occupational wage data (2025), adjusted for regional cost-of-living differences using BEA RPP (Regional Price Parities).
2026 figures are projected from 2025 BLS data using a compound annual growth rate (CAGR) of 2.52%, derived from historical BLS wage trends for plumbers (SOC 47-2152).
Compiled and verified by Samuel Torres, CWP, a licensed plumber with 10+ years of clinical experience. · View source data at BLS.gov