Plumber Salary in Richmond, VA: $63,029 (2026)
Quick Answer:A full-time plumber in Richmond, VA earns a median $63,029/year (≈ $30.30/hour) in nominal terms for 2026 — projected from BLS OEWS 2025 (SOC 47-2152). Once you factor in Richmond's price level (2% below national, BEA RPP 97.9), that paycheck buys what $64,409 would nationally. Nominal pay sits 8.8% above the Virginia state average.
Official BLS data · View source
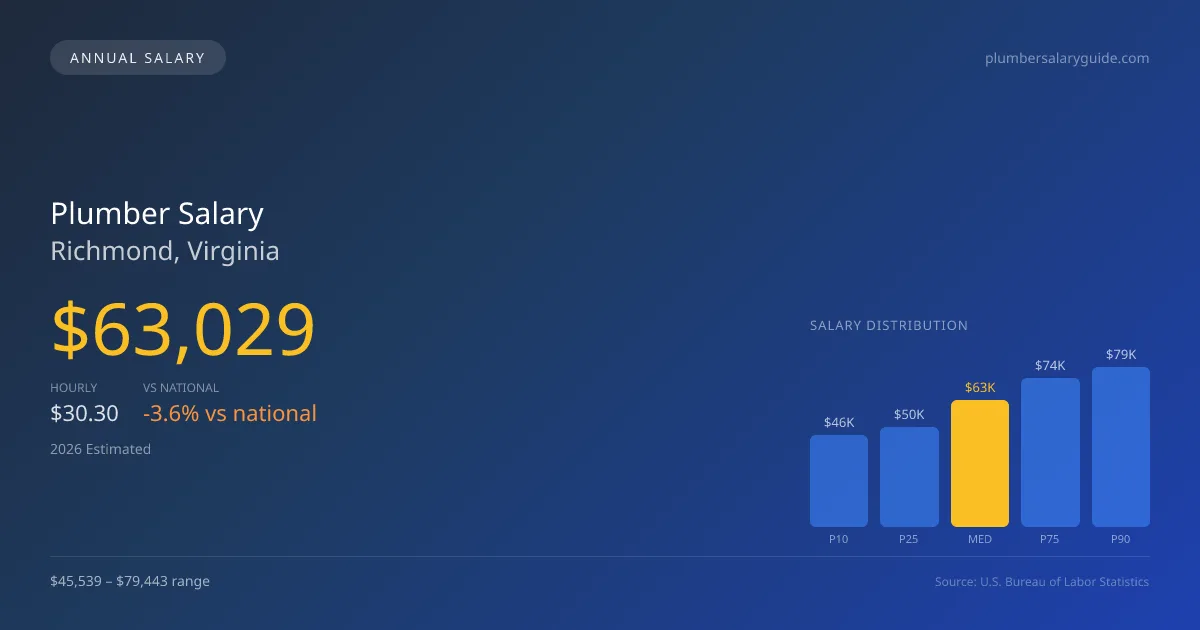
For plumbers in Richmond, VA, achieving a specialty certification in areas like medical gas installation or industrial piping can significantly elevate earning potential. The projected median annual salary stands at $63,029, which is slightly below the national median of $65,408. With a salary range extending from $45,539 at the 10th percentile to $79,443 at the 90th percentile, this data reflects the trends identified in the 2025 BLS OEWS surveys. Richmond's plumbing job market shows a healthy demand, fueled by an aging infrastructure and a workforce that is also reaching retirement age, creating ongoing opportunities for both entry-level positions and seasoned professionals.
Salary Breakdown
| Percentile | Annual | Hourly |
|---|---|---|
| Entry Level (P10) | $45,539 | $21.90 |
| Lower Range (P25) | $49,722 | $23.91 |
| Median (P50)(typical) | $63,029 | $30.30 |
| Upper Range (P75) | $73,835 | $35.50 |
| Top Earners (P90) | $79,443 | $38.20 |
Median Salary Position
3.64% below the national average
2026 Salary Percentile Distribution in Richmond
In Richmond, VA, the plumber salary spread from the 10th to 90th percentile is $33,904 (2026 est.). At $63,029, the local median is 3.64% below the national median of $65,408.
Salary Calculator
At 40 hours/week in Richmond: You'd be above the median
How Richmond Plumber Pay Compares
Richmond median: $63,029/year (2026)
| Compared To | Median Salary | Richmond Pays |
|---|---|---|
| Virginia Average | $57,931 | +8.80% more |
| National Average | $65,408 | -3.64% less |
Plumbers in Richmond, VA earn a median of $63,029 per year (2026 est.), which is 3.64% lower than the national median of $65,408 and 8.80% above the Virginia state average of $57,931.
Cost-of-Living Adjusted Salary
Richmond has a cost of living 2.14% below the national average, meaning your salary goes further here.
Adjusted salary = nominal × (100 / CoL index). CoL index: 100 = national average.
Richmond, VA has a cost-of-living index of 97.858 (below the national average of 100). A plumber earning $63,029 nominally has purchasing power equivalent to $64,409 in an average-cost city — an effective 2.19% boost.
Compare Purchasing Power
Select a city to see how your salary compares after cost of living
Select a city above to compare purchasing power
2019 BLS Actual
$52,150
2025 BLS Actual
$61,480
2026 Current Est.
$63,029
2019–2027 Growth
+23.9%
Salary Trajectory for Plumbers in Richmond (2019–2027)
2019–2025: actual BLS OEWS data for this metro area. 2026+: CAGR 2.52% projection.
| Year | Annual Salary | Status |
|---|---|---|
| 2019 | $52,150 | Actual |
| 2020 | $51,970 | Actual |
| 2021 | $48,940 | Actual |
| 2022 | $48,940 | Actual |
| 2023 | $58,830 | Actual |
| 2024 | $59,970 | Actual |
| 2025 | $61,480 | Actual |
| 2026(current) | $63,029 | Estimated |
| 2027 | $64,618 | Projected |
Based on 7 years of BLS OEWS data for the Richmond metropolitan area, the median plumber salary grew 17.9% from $52,150 (2019) to $61,480 (2025). At a 2.52% compound annual growth rate, salaries are projected to reach $64,618 by 2027 — a total increase of $12,468 (23.91%) from 2019.
Note: Historical values (2019–2025) are actual BLS OEWS figures for the Richmond metropolitan area, sourced from annual Occupational Employment and Wage Statistics surveys. 2026–2026 figures are current estimates, and 2027 values are projections, calculated using a 2.52% CAGR derived from 7-year BLS historical data. Actual salaries may vary based on employer, experience, certifications, and local market conditions.
Salary by Experience Level
| Experience | Estimated Salary Range |
|---|---|
| 0-2 years (New Graduate) | $45,539 – $49,722 |
| 3-5 years (Mid Career) | $49,722 – $63,029 |
| 5+ years (Experienced) | $63,029 – $73,835 |
| 10+ years (Top Earner) | $73,835 – $79,443 |
Plumber salary ranges estimated from BLS percentile data. Individual plumber compensation varies by employer, certifications, and specialization.
Plumber Job Market in Richmond
In Richmond, approximately 2,340 plumbers are currently employed, which underscores a robust local job market. The cost of living index at 97.858 indicates that while the plumber salary in Richmond is competitive, it is essential to consider purchasing power when evaluating compensation. Higher-paying employers typically include union plumbing contractors that offer better wages compared to non-union or open-shop firms. Specialties such as medical gas and backflow prevention command a premium that can significantly boost earnings. Other factors influencing salary variations include individual agreements, overtime compensation, and commission structures prevalent in service companies like Roto-Rooter. For those seeking to maximize plumber pay in Richmond VA, investing in advanced certifications and considering union affiliation can lead to more lucrative opportunities in a market where specialized skills are increasingly in demand.
More salary data for Richmond, VA:
Frequently Asked Questions
How much do plumbers make in Richmond, VA in 2026?
Is Richmond, VA a good place to work as a plumber?
Can plumbers make $100K in Richmond?
What is the cost-of-living adjusted plumber salary in Richmond?
How much does a plumber make per hour in Richmond?
Related Pages
Compare Salaries
Career Resources
Nearby Cities in Virginia
Written by Samuel Torres, CWP
Career Analyst
Samuel Torres has 10 years of experience in plumbing. He specializes in residential plumbing systems. He has worked with several home improvement companies.
Methodology & Data Source
Salary figures on this page are 2026 projections based on the Bureau of Labor Statistics Occupational Employment and Wage Statistics (OEWS) survey, May 2026 release. The BLS reported a median annual salary of $61,480 for plumbersin the Richmond metropolitan area. A 2.52% compound annual growth rate (CAGR), calculated from 6-year national BLS wage trends, was applied to project current 2026 compensation. Percentile ranges (P10–P90) represent the full salary distribution across experience levels and practice settings in this market.
Data Sources & Methodology
Source: BLS, OEWS, 7-year dataset (–). Per-city data from annual BLS metropolitan area surveys.
2026 figures are projected from 2025 BLS data using a compound annual growth rate (CAGR) of 2.52%, derived from historical BLS wage trends for plumbers (SOC 47-2152).
Compiled and verified by Samuel Torres, CWP, a licensed plumber with 10+ years of clinical experience. · View source data at BLS.gov