Plumber Salary in Bellingham, WA: $105,339 (2026)
Quick Answer:A full-time plumber in Bellingham, WA earns a median $105,339/year (≈ $50.64/hour) in nominal terms for 2026 — projected from BLS OEWS 2025 (SOC 47-2152). Once you factor in Bellingham's price level (3% above national, BEA RPP 103.3), that paycheck buys what $101,940 would nationally. Nominal pay sits 28.4% above the Washington state average.
Official BLS data · View source
In Bellingham, Washington, the plumber salary landscape reflects a significant disparity driven primarily by union affiliations. The 2026 median salary for plumbers in the area is projected at $105,339, which is substantially higher than the national median of $65,408, illustrating a 61.05% premium. Within Bellingham's market, salaries range from a lower threshold of $50,870 to $148,182 at the higher end, indicating a broad divergence in earnings based on experience and type of employment. These figures, derived from the official Bureau of Labor Statistics (BLS) Occupational Employment and Wage Statistics (OEWS) surveys, reveal that union pipefitters generally earn 30-50% more than their non-union counterparts, dominating the higher echelons of plumber compensation in the region.
Salary Breakdown
| Percentile | Annual | Hourly |
|---|---|---|
| Entry Level (P10) | $50,870 | $24.46 |
| Lower Range (P25) | $65,100 | $31.30 |
| Median (P50)(typical) | $105,339 | $50.64 |
| Upper Range (P75) | $148,182 | $71.24 |
| Top Earners (P90) | $148,182 | $71.24 |
Median Salary Position
61.05% above the national average
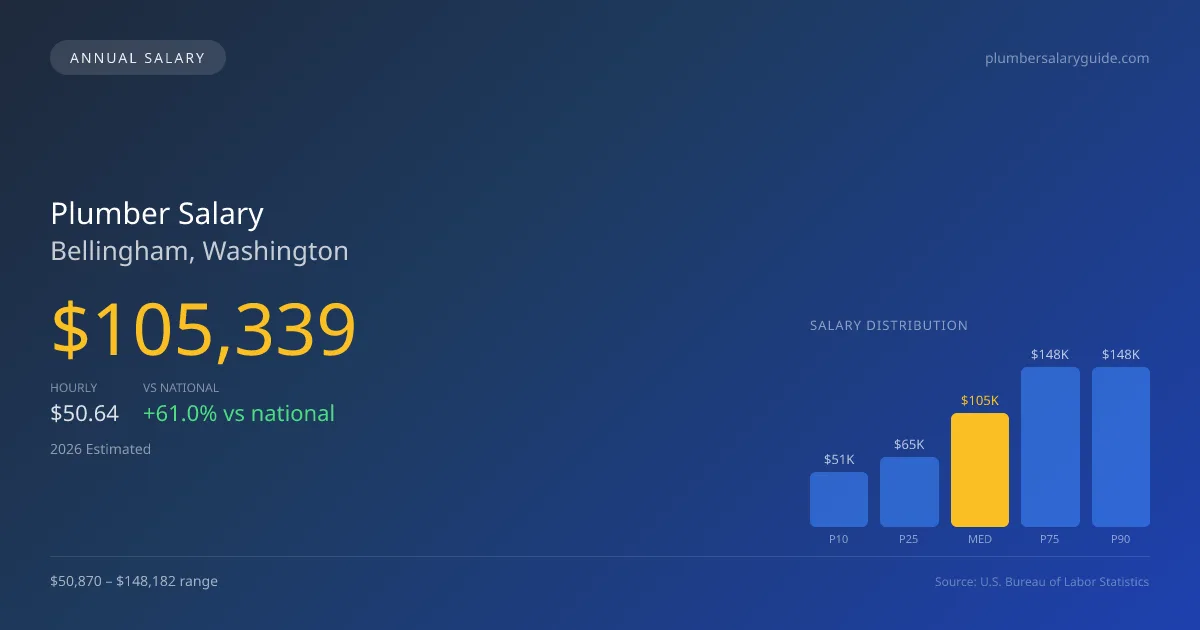
2026 Salary Percentile Distribution in Bellingham
In Bellingham, WA, the plumber salary spread from the 10th to 90th percentile is $97,312 (2026 est.). At $105,339, the local median is 61.05% above the national median of $65,408.
Salary Calculator
At 40 hours/week in Bellingham: You'd be above the median
How Bellingham Plumber Pay Compares
Bellingham median: $105,339/year (2026)
| Compared To | Median Salary | Bellingham Pays |
|---|---|---|
| Washington Average | $82,040 | +28.40% more |
| National Average | $65,408 | +61.05% more |
Plumbers in Bellingham, WA earn a median of $105,339 per year (2026 est.), which is 61.05% higher than the national median of $65,408 and 28.40% above the Washington state average of $82,040.
Cost-of-Living Adjusted Salary
Bellingham has a cost of living 3.33% above the national average.
Adjusted salary = nominal × (100 / CoL index). CoL index: 100 = national average.
Bellingham, WA has a cost-of-living index of 103.334 (above the national average of 100). While the nominal salary of $105,339 is competitive, the higher cost of living reduces purchasing power to an effective $101,940 — a 3.23% reduction.
Compare Purchasing Power
Select a city to see how your salary compares after cost of living
Select a city above to compare purchasing power
2019 BLS Actual
$60,800
2025 BLS Actual
$102,750
2026 Current Est.
$105,339
2019–2027 Growth
+77.6%
Salary Trajectory for Plumbers in Bellingham (2019–2027)
2019–2025: actual BLS OEWS data for this metro area. 2026+: CAGR 2.52% projection.
| Year | Annual Salary | Status |
|---|---|---|
| 2019 | $60,800 | Actual |
| 2020 | $62,650 | Actual |
| 2021 | $71,550 | Actual |
| 2022 | $71,100 | Actual |
| 2023 | $66,250 | Actual |
| 2024 | $76,150 | Actual |
| 2025 | $102,750 | Actual |
| 2026(current) | $105,339 | Estimated |
| 2027 | $107,994 | Projected |
Based on 7 years of BLS OEWS data for the Bellingham metropolitan area, the median plumber salary grew 69.0% from $60,800 (2019) to $102,750 (2025). At a 2.52% compound annual growth rate, salaries are projected to reach $107,994 by 2027 — a total increase of $47,194 (77.62%) from 2019.
Note: Historical values (2019–2025) are actual BLS OEWS figures for the Bellingham metropolitan area, sourced from annual Occupational Employment and Wage Statistics surveys. 2026–2026 figures are current estimates, and 2027 values are projections, calculated using a 2.52% CAGR derived from 7-year BLS historical data. Actual salaries may vary based on employer, experience, certifications, and local market conditions.
Salary by Experience Level
| Experience | Estimated Salary Range |
|---|---|
| 0-2 years (New Graduate) | $50,870 – $65,100 |
| 3-5 years (Mid Career) | $65,100 – $105,339 |
| 5+ years (Experienced) | $105,339 – $148,182 |
| 10+ years (Top Earner) | $148,182 – $148,182 |
Plumber salary ranges estimated from BLS percentile data. Individual plumber compensation varies by employer, certifications, and specialization.
Plumber Job Market in Bellingham
In terms of local employment, Bellingham has approximately 540 plumbers, which denotes a healthy job market for this profession. However, the cost of living index in the city stands at 103.334, slightly above the national average, indicating that taking-home pay might not stretch as far as in less expensive areas. Typically, employers that offer the highest compensation include union plumbing contractors affiliated with the UA, industrial maintenance teams, and larger service providers like Roto-Rooter and ARS, while non-union service and residential plumbing often yield lower earnings. The variance in pay stems from factors including specialization in medical gas or industrial pipefitting, as well as possession of advanced licenses. To optimize earnings, plumbers in Bellingham should consider gaining expertise in emerging specialties and pursuing union membership to access better wages and benefits.
More salary data for Bellingham, WA:
Frequently Asked Questions
How much do plumbers make in Bellingham, WA in 2026?
Is Bellingham, WA a good place to work as a plumber?
Can plumbers make $100K in Bellingham?
What is the cost-of-living adjusted plumber salary in Bellingham?
How much does a plumber make per hour in Bellingham?
Related Pages
Compare Salaries
Career Resources
Nearby Cities in Washington
Written by Samuel Torres, CWP
Career Analyst
Samuel Torres has 10 years of experience in plumbing. He specializes in residential plumbing systems. He has worked with several home improvement companies.
Methodology & Data Source
Salary figures on this page are 2026 projections based on the Bureau of Labor Statistics Occupational Employment and Wage Statistics (OEWS) survey, May 2026 release. The BLS reported a median annual salary of $102,750 for plumbersin the Bellingham metropolitan area. A 2.52% compound annual growth rate (CAGR), calculated from 6-year national BLS wage trends, was applied to project current 2026 compensation. Percentile ranges (P10–P90) represent the full salary distribution across experience levels and practice settings in this market.
Data Sources & Methodology
Source: BLS, OEWS, 7-year dataset (–). Per-city data from annual BLS metropolitan area surveys.
2026 figures are projected from 2025 BLS data using a compound annual growth rate (CAGR) of 2.52%, derived from historical BLS wage trends for plumbers (SOC 47-2152).
Compiled and verified by Samuel Torres, CWP, a licensed plumber with 10+ years of clinical experience. · View source data at BLS.gov