Plumber Salary in Burien, WA: $81,665 (2026)
Quick Answer:A full-time plumber in Burien, WA earns a median $81,665/year (≈ $39.27/hour) in nominal terms for 2026 — projected from BLS OEWS 2025 (SOC 47-2152). Once you factor in Burien's price level (7% above national, BEA RPP 107.4), that paycheck buys what $76,038 would nationally. Nominal pay sits 0.5% below the Washington state average.
Based on BLS state-level estimates · View source
In 2026, a plumber in Burien, Washington, can expect a competitive median salary of $81,665, significantly above the national median of $65,408. This reflects the influence of unionization in the area, where UA signatories often enjoy higher wages compared to their non-union counterparts, with notable pay gaps. Plumber salaries range from $58,399 at the lower end to $126,581 for the most experienced professionals, showcasing diverse opportunities for career advancement within the field. These figures are based on 2025 BLS data, projected to 2026, and account for local cost-of-living adjustments, placing Burien's plumbing sector in a robust market context that is enhanced by the ongoing demand for skilled trades.
About the Burien Market
Salary estimated from Washington average ($82,000) adjusted for local cost of living.
Salary Breakdown
| Percentile | Annual | Hourly |
|---|---|---|
| Entry Level (P10) | $58,399 | $28.08 |
| Lower Range (P25) | $65,048 | $31.27 |
| Median (P50)(typical) | $81,665 | $39.27 |
| Upper Range (P75) | $104,531 | $50.26 |
| Top Earners (P90) | $126,581 | $60.86 |
Median Salary Position
24.85% above the national average
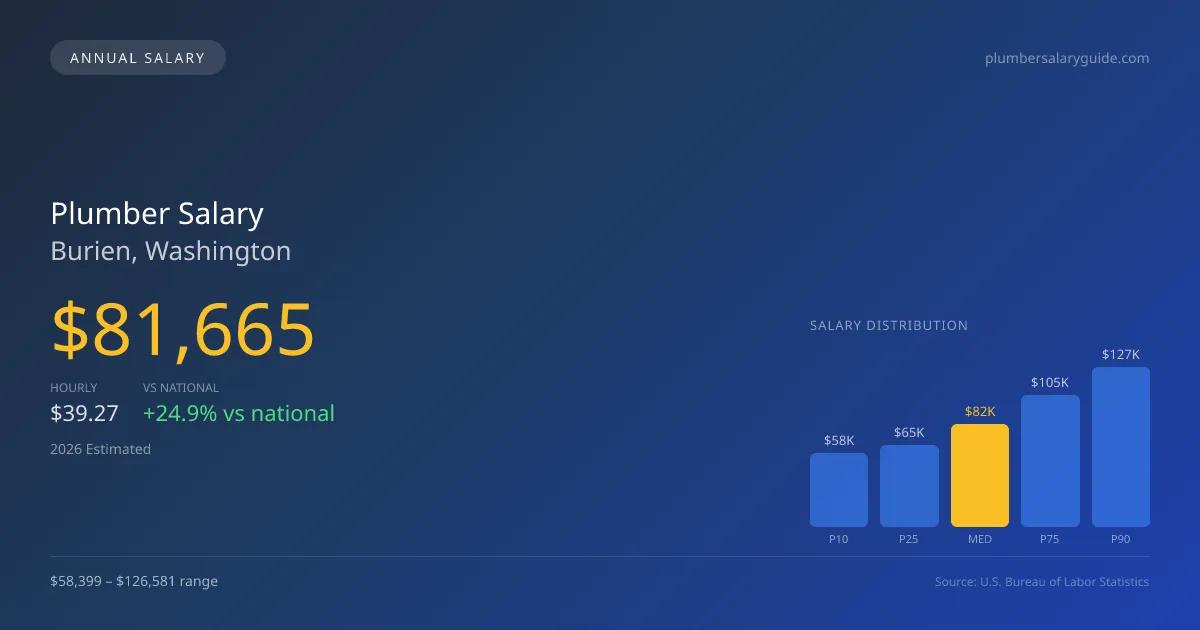
2026 Salary Percentile Distribution in Burien
In Burien, WA, the plumber salary spread from the 10th to 90th percentile is $68,182 (2026 est.). At $81,665, the local median is 24.85% above the national median of $65,408.
Salary Calculator
At 40 hours/week in Burien: You'd be in the lower-middle range
How Burien Plumber Pay Compares
Burien median: $81,665/year (2026)
| Compared To | Median Salary | Burien Pays |
|---|---|---|
| Washington Average | $82,076 | -0.50% less |
| National Average | $65,408 | +24.85% more |
Plumbers in Burien, WA earn a median of $81,665 per year (2026 est.), which is 24.85% higher than the national median of $65,408 and 0.50% below the Washington state average of $82,076.
Cost-of-Living Adjusted Salary
Burien has a cost of living 7.40% above the national average.
Adjusted salary = nominal × (100 / CoL index). CoL index: 100 = national average.
Burien, WA has a cost-of-living index of 107.4 (above the national average of 100). While the nominal salary of $81,665 is competitive, the higher cost of living reduces purchasing power to an effective $76,038 — a 6.89% reduction.
Compare Purchasing Power
Select a city to see how your salary compares after cost of living
Select a city above to compare purchasing power
2019 BLS Actual
$68,870
2025 BLS Actual
$79,658
2026 Current Est.
$81,665
2019–2027 Growth
+21.6%
Salary Trajectory for Plumbers in Burien (2019–2027)
2019–2025: actual BLS OEWS data for this metro area. 2026+: CAGR 2.52% projection.
| Year | Annual Salary | Status |
|---|---|---|
| 2019 | $68,870 | Actual |
| 2020 | $70,331 | Actual |
| 2021 | $74,764 | Actual |
| 2022 | $75,026 | Actual |
| 2023 | $76,849 | Actual |
| 2024 | $87,658 | Actual |
| 2025 | $79,658 | Actual |
| 2026(current) | $81,665 | Estimated |
| 2027 | $83,723 | Projected |
Based on 7 years of BLS OEWS data for the Burien metropolitan area, the median plumber salary grew 15.7% from $68,870 (2019) to $79,658 (2025). At a 2.52% compound annual growth rate, salaries are projected to reach $83,723 by 2027 — a total increase of $14,853 (21.57%) from 2019.
Note: Historical values (2019–2025) are actual BLS OEWS figures for the Burien metropolitan area, sourced from annual Occupational Employment and Wage Statistics surveys. 2026–2026 figures are current estimates, and 2027 values are projections, calculated using a 2.52% CAGR derived from 7-year BLS historical data. Actual salaries may vary based on employer, experience, certifications, and local market conditions.
Salary by Experience Level
| Experience | Estimated Salary Range |
|---|---|
| 0-2 years (New Graduate) | $58,399 – $65,048 |
| 3-5 years (Mid Career) | $65,048 – $81,665 |
| 5+ years (Experienced) | $81,665 – $104,531 |
| 10+ years (Top Earner) | $104,531 – $126,581 |
Plumber salary ranges estimated from BLS percentile data. Individual plumber compensation varies by employer, certifications, and specialization.
Plumber Job Market in Burien
The job market for plumbers in Burien features only eight employed professionals, indicating a niche yet competitive landscape. With a cost-of-living index of 107.4, living expenses are slightly above the national average, impacting the effective take-home pay for those in the trade. Among local employers, union plumbing contractors often provide the highest salaries, specifically for pipefitters and steamfitters, while self-employed plumbers and larger service companies like Roto-Rooter may offer variable incomes that can fluctuate based on commission structures and job type. The pay spread reflects factors like specialization in medical gas or industrial plumbing, licensing levels, and the potential for overtime. To maximize earning potential in Burien, plumbers should consider pursuing advanced certifications, maintaining a strong client base if self-employed, and exploring collaborations with union contractors to tap into the market's full salary range.
More salary data for Burien, WA:
Frequently Asked Questions
How much do plumbers make in Burien, WA in 2026?
Is Burien, WA a good place to work as a plumber?
Can plumbers make $100K in Burien?
What is the cost-of-living adjusted plumber salary in Burien?
How much does a plumber make per hour in Burien?
Related Pages
Compare Salaries
Career Resources
Nearby Cities in Washington
Written by Samuel Torres, CWP
Career Analyst
Samuel Torres has 10 years of experience in plumbing. He specializes in residential plumbing systems. He has worked with several home improvement companies.
Methodology & Data Source
Salary figures on this page are 2026 projections based on the Bureau of Labor Statistics Occupational Employment and Wage Statistics (OEWS) survey, May 2026 release. The BLS reported a median annual salary of $79,658 for plumbersin the Burien metropolitan area. A 2.52% compound annual growth rate (CAGR), calculated from 6-year national BLS wage trends, was applied to project current 2026 compensation. Percentile ranges (P10–P90) represent the full salary distribution across experience levels and practice settings in this market.
Data Sources & Methodology
Salary data for Burien is estimated from official BLS state-level occupational wage data (2025), adjusted for regional cost-of-living differences using BEA RPP (Regional Price Parities).
2026 figures are projected from 2025 BLS data using a compound annual growth rate (CAGR) of 2.52%, derived from historical BLS wage trends for plumbers (SOC 47-2152).
Compiled and verified by Samuel Torres, CWP, a licensed plumber with 10+ years of clinical experience. · View source data at BLS.gov