Plumber Salary in Pullman, WA: $78,742 (2026)
Quick Answer:A full-time plumber in Pullman, WA earns a median $78,742/year (≈ $37.86/hour) in nominal terms for 2026 — projected from BLS OEWS 2025 (SOC 47-2152). Once you factor in Pullman's price level (7% above national, BEA RPP 107.4), that paycheck buys what $73,317 would nationally. Nominal pay sits 4.0% below the Washington state average.
Based on BLS state-level estimates · View source
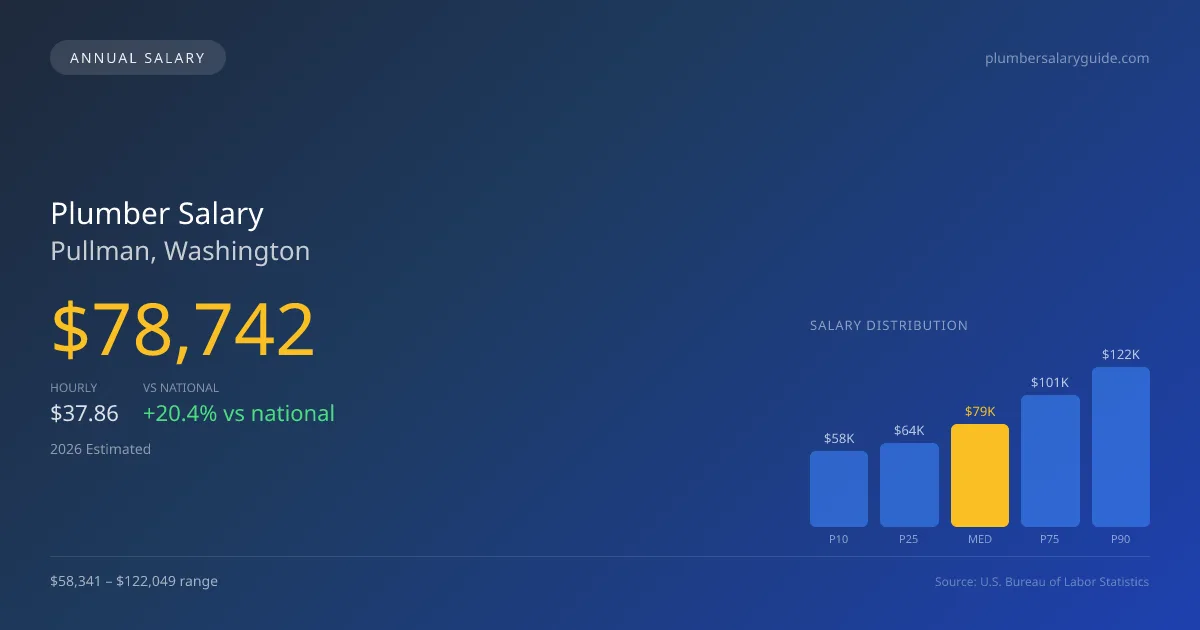
In 2026, plumbers in Pullman, Washington, are projected to earn a median annual salary of $78,742, significantly above the national median of $65,408. The salary spectrum ranges from $58,341 at the 10th percentile to $122,049 at the 90th percentile, showcasing strong earning potential in this profession. These estimates are based on 2025 BLS data, adjusted for regional cost factors, and reflect a competitive market that may favor specialty skills, such as medical gas certification and industrial plumbing. As the area experiences demand for skilled labor, reaching these specialty premiums can substantially impact overall compensation.
About the Pullman Market
Salary estimated from Washington average ($82,000) adjusted for local cost of living.
Salary Breakdown
| Percentile | Annual | Hourly |
|---|---|---|
| Entry Level (P10) | $58,341 | $28.05 |
| Lower Range (P25) | $63,897 | $30.71 |
| Median (P50)(typical) | $78,742 | $37.86 |
| Upper Range (P75) | $100,789 | $48.46 |
| Top Earners (P90) | $122,049 | $58.68 |
Median Salary Position
20.39% above the national average
2026 Salary Percentile Distribution in Pullman
In Pullman, WA, the plumber salary spread from the 10th to 90th percentile is $63,708 (2026 est.). At $78,742, the local median is 20.39% above the national median of $65,408.
Salary Calculator
At 40 hours/week in Pullman: You'd be in the lower-middle range
How Pullman Plumber Pay Compares
Pullman median: $78,742/year (2026)
| Compared To | Median Salary | Pullman Pays |
|---|---|---|
| Washington Average | $82,022 | -4.00% less |
| National Average | $65,408 | +20.39% more |
Plumbers in Pullman, WA earn a median of $78,742 per year (2026 est.), which is 20.39% higher than the national median of $65,408 and 4.00% below the Washington state average of $82,022.
Cost-of-Living Adjusted Salary
Pullman has a cost of living 7.40% above the national average.
Adjusted salary = nominal × (100 / CoL index). CoL index: 100 = national average.
Pullman, WA has a cost-of-living index of 107.4 (above the national average of 100). While the nominal salary of $78,742 is competitive, the higher cost of living reduces purchasing power to an effective $73,317 — a 6.89% reduction.
Compare Purchasing Power
Select a city to see how your salary compares after cost of living
Select a city above to compare purchasing power
2019 BLS Actual
$66,405
2025 BLS Actual
$76,806
2026 Current Est.
$78,742
2019–2027 Growth
+21.6%
Salary Trajectory for Plumbers in Pullman (2019–2027)
2019–2025: actual BLS OEWS data for this metro area. 2026+: CAGR 2.52% projection.
| Year | Annual Salary | Status |
|---|---|---|
| 2019 | $66,405 | Actual |
| 2020 | $67,813 | Actual |
| 2021 | $72,087 | Actual |
| 2022 | $72,340 | Actual |
| 2023 | $74,097 | Actual |
| 2024 | $84,520 | Actual |
| 2025 | $76,806 | Actual |
| 2026(current) | $78,742 | Estimated |
| 2027 | $80,726 | Projected |
Based on 7 years of BLS OEWS data for the Pullman metropolitan area, the median plumber salary grew 15.7% from $66,405 (2019) to $76,806 (2025). At a 2.52% compound annual growth rate, salaries are projected to reach $80,726 by 2027 — a total increase of $14,321 (21.57%) from 2019.
Note: Historical values (2019–2025) are actual BLS OEWS figures for the Pullman metropolitan area, sourced from annual Occupational Employment and Wage Statistics surveys. 2026–2026 figures are current estimates, and 2027 values are projections, calculated using a 2.52% CAGR derived from 7-year BLS historical data. Actual salaries may vary based on employer, experience, certifications, and local market conditions.
Salary by Experience Level
| Experience | Estimated Salary Range |
|---|---|
| 0-2 years (New Graduate) | $58,341 – $63,897 |
| 3-5 years (Mid Career) | $63,897 – $78,742 |
| 5+ years (Experienced) | $78,742 – $100,789 |
| 10+ years (Top Earner) | $100,789 – $122,049 |
Plumber salary ranges estimated from BLS percentile data. Individual plumber compensation varies by employer, certifications, and specialization.
Plumber Job Market in Pullman
The plumber pay landscape in Pullman includes only six plumbers currently employed, highlighting the niche market. With a cost of living index at 107.4, earnings here may feel constrained relative to expenses. Employers may vary in wages; union plumbing contractors, especially those in the United Association (UA), typically offer higher salaries, reflecting the union's strength in driving pay for pipefitters and steamfitters. In contrast, non-union contractors, service companies, and municipal water utilities may provide lower compensation, though they often offer more flexible work hours. For those aiming to maximize pay, pursuing a master plumber license and specialty credentials can elevate income potential, especially in sectors with rising demand due to aging infrastructure and workforce. Consider targeting opportunities with high-demand employers while also staying adaptive to the diverse plumbing segments within Pullman.
More salary data for Pullman, WA:
Frequently Asked Questions
How much do plumbers make in Pullman, WA in 2026?
Is Pullman, WA a good place to work as a plumber?
Can plumbers make $100K in Pullman?
What is the cost-of-living adjusted plumber salary in Pullman?
How much does a plumber make per hour in Pullman?
Related Pages
Compare Salaries
Career Resources
Nearby Cities in Washington
Written by Samuel Torres, CWP
Career Analyst
Samuel Torres has 10 years of experience in plumbing. He specializes in residential plumbing systems. He has worked with several home improvement companies.
Methodology & Data Source
Salary figures on this page are 2026 projections based on the Bureau of Labor Statistics Occupational Employment and Wage Statistics (OEWS) survey, May 2026 release. The BLS reported a median annual salary of $76,806 for plumbersin the Pullman metropolitan area. A 2.52% compound annual growth rate (CAGR), calculated from 6-year national BLS wage trends, was applied to project current 2026 compensation. Percentile ranges (P10–P90) represent the full salary distribution across experience levels and practice settings in this market.
Data Sources & Methodology
Salary data for Pullman is estimated from official BLS state-level occupational wage data (2025), adjusted for regional cost-of-living differences using BEA RPP (Regional Price Parities).
2026 figures are projected from 2025 BLS data using a compound annual growth rate (CAGR) of 2.52%, derived from historical BLS wage trends for plumbers (SOC 47-2152).
Compiled and verified by Samuel Torres, CWP, a licensed plumber with 10+ years of clinical experience. · View source data at BLS.gov