Plumber Salary in West Bend, WI: $85,788 (2026)
Quick Answer:A full-time plumber in West Bend, WI earns a median $85,788/year (≈ $41.24/hour) in nominal terms for 2026 — projected from BLS OEWS 2025 (SOC 47-2152). Once you factor in West Bend's price level (7% below national, BEA RPP 93.4), that paycheck buys what $91,850 would nationally. Nominal pay sits 1.7% below the Wisconsin state average.
Based on BLS state-level estimates · View source
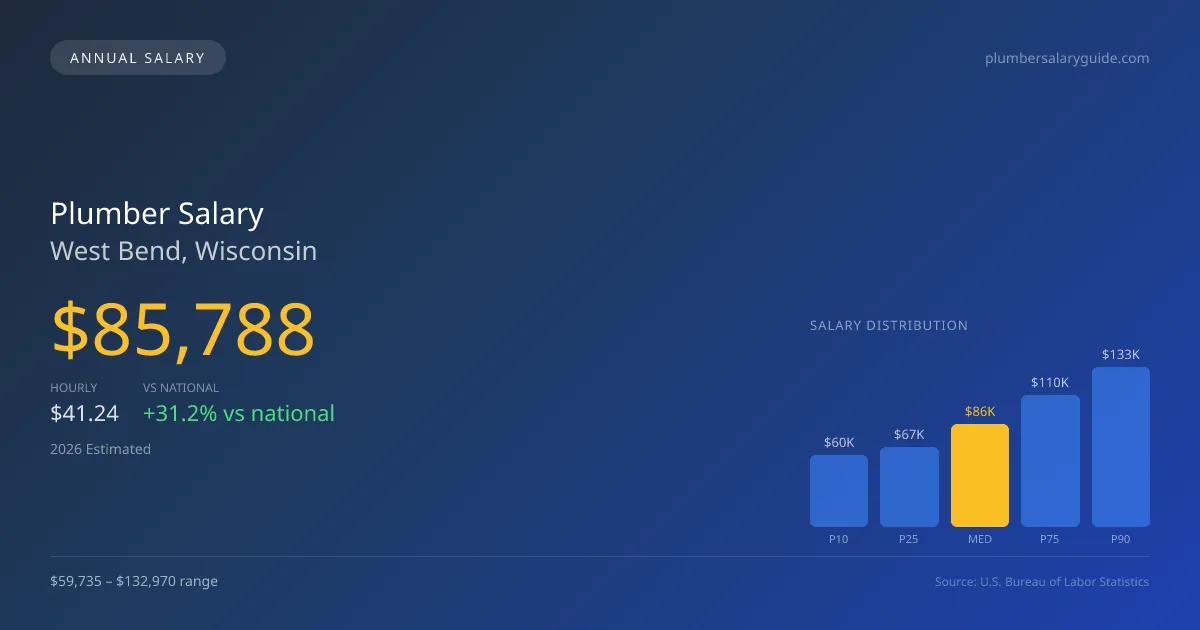
In the plumbing industry in West Bend, Wisconsin, the projected median annual salary for 2026 stands at $85,788, significantly surpassing the national figure of $65,408, reflecting a 31.16% boost. The salary range for plumbers in this area stretches from $59,735 at the 10th percentile to $132,970 at the 90th percentile, illustrating the variability in earnings based on experience levels and specialization. Estimates derived from 2025 BLS state-level data and regional price adjustments highlight the competitive nature of the local job market, influenced by the prevalence of UA union pipefitters, which typically command higher wages than their non-union counterparts. Given this landscape, those seeking work as plumbers in West Bend can expect solid earning potential, especially when affiliated with unions which provide better compensation and benefits.
About the West Bend Market
Salary estimated from Wisconsin average ($72,000) adjusted for local cost of living.
Salary Breakdown
| Percentile | Annual | Hourly |
|---|---|---|
| Entry Level (P10) | $59,735 | $28.72 |
| Lower Range (P25) | $66,854 | $32.14 |
| Median (P50)(typical) | $85,788 | $41.24 |
| Upper Range (P75) | $109,808 | $52.79 |
| Top Earners (P90) | $132,970 | $63.93 |
Median Salary Position
31.16% above the national average
2026 Salary Percentile Distribution in West Bend
In West Bend, WI, the plumber salary spread from the 10th to 90th percentile is $73,235 (2026 est.). At $85,788, the local median is 31.16% above the national median of $65,408.
Salary Calculator
At 40 hours/week in West Bend: You'd be in the lower-middle range
How West Bend Plumber Pay Compares
West Bend median: $85,788/year (2026)
| Compared To | Median Salary | West Bend Pays |
|---|---|---|
| Wisconsin Average | $87,271 | -1.70% less |
| National Average | $65,408 | +31.16% more |
Plumbers in West Bend, WI earn a median of $85,788 per year (2026 est.), which is 31.16% higher than the national median of $65,408 and 1.70% below the Wisconsin state average of $87,271.
Cost-of-Living Adjusted Salary
West Bend has a cost of living 6.60% below the national average, meaning your salary goes further here.
Adjusted salary = nominal × (100 / CoL index). CoL index: 100 = national average.
West Bend, WI has a cost-of-living index of 93.4 (below the national average of 100). A plumber earning $85,788 nominally has purchasing power equivalent to $91,850 in an average-cost city — an effective 7.07% boost.
Compare Purchasing Power
Select a city to see how your salary compares after cost of living
Select a city above to compare purchasing power
2019 BLS Actual
$72,347
2025 BLS Actual
$83,679
2026 Current Est.
$85,788
2019–2027 Growth
+21.6%
Salary Trajectory for Plumbers in West Bend (2019–2027)
2019–2025: actual BLS OEWS data for this metro area. 2026+: CAGR 2.52% projection.
| Year | Annual Salary | Status |
|---|---|---|
| 2019 | $72,347 | Actual |
| 2020 | $73,881 | Actual |
| 2021 | $78,538 | Actual |
| 2022 | $78,813 | Actual |
| 2023 | $80,728 | Actual |
| 2024 | $66,079 | Actual |
| 2025 | $83,679 | Actual |
| 2026(current) | $85,788 | Estimated |
| 2027 | $87,950 | Projected |
Based on 7 years of BLS OEWS data for the West Bend metropolitan area, the median plumber salary grew 15.7% from $72,347 (2019) to $83,679 (2025). At a 2.52% compound annual growth rate, salaries are projected to reach $87,950 by 2027 — a total increase of $15,603 (21.57%) from 2019.
Note: Historical values (2019–2025) are actual BLS OEWS figures for the West Bend metropolitan area, sourced from annual Occupational Employment and Wage Statistics surveys. 2026–2026 figures are current estimates, and 2027 values are projections, calculated using a 2.52% CAGR derived from 7-year BLS historical data. Actual salaries may vary based on employer, experience, certifications, and local market conditions.
Salary by Experience Level
| Experience | Estimated Salary Range |
|---|---|
| 0-2 years (New Graduate) | $59,735 – $66,854 |
| 3-5 years (Mid Career) | $66,854 – $85,788 |
| 5+ years (Experienced) | $85,788 – $109,808 |
| 10+ years (Top Earner) | $109,808 – $132,970 |
Plumber salary ranges estimated from BLS percentile data. Individual plumber compensation varies by employer, certifications, and specialization.
Plumber Job Market in West Bend
In West Bend, the local plumbing job market remains relatively tight, with only five plumbers currently employed in the area. The cost-of-living index here is 93.4, which indicates a lower-than-average expense compared to national standards, allowing plumbers to enjoy stronger purchasing power. Employers paying the highest wages tend to be UA union contractors, offering substantial benefits and favorable terms compared to non-union or open-shop firms. This spread in pay is driven by factors such as specialization, with medical gas and industrial piping commanding higher rates, in addition to the potential for increased earnings through commission at service companies like Roto-Rooter and ARS. For plumbers looking to maximize their income in West Bend, obtaining advanced certifications and licenses, focusing on high-demand specialties, and aligning with union employment can greatly enhance earning potential in this competitive field.
More salary data for West Bend, WI:
Frequently Asked Questions
How much do plumbers make in West Bend, WI in 2026?
Is West Bend, WI a good place to work as a plumber?
Can plumbers make $100K in West Bend?
What is the cost-of-living adjusted plumber salary in West Bend?
How much does a plumber make per hour in West Bend?
Related Pages
Compare Salaries
Career Resources
Nearby Cities in Wisconsin
Written by Samuel Torres, CWP
Career Analyst
Samuel Torres has 10 years of experience in plumbing. He specializes in residential plumbing systems. He has worked with several home improvement companies.
Methodology & Data Source
Salary figures on this page are 2026 projections based on the Bureau of Labor Statistics Occupational Employment and Wage Statistics (OEWS) survey, May 2026 release. The BLS reported a median annual salary of $83,679 for plumbersin the West Bend metropolitan area. A 2.52% compound annual growth rate (CAGR), calculated from 6-year national BLS wage trends, was applied to project current 2026 compensation. Percentile ranges (P10–P90) represent the full salary distribution across experience levels and practice settings in this market.
Data Sources & Methodology
Salary data for West Bend is estimated from official BLS state-level occupational wage data (2025), adjusted for regional cost-of-living differences using BEA RPP (Regional Price Parities).
2026 figures are projected from 2025 BLS data using a compound annual growth rate (CAGR) of 2.52%, derived from historical BLS wage trends for plumbers (SOC 47-2152).
Compiled and verified by Samuel Torres, CWP, a licensed plumber with 10+ years of clinical experience. · View source data at BLS.gov