Plumber Salary in Gillette, WY: $59,363 (2026)
Quick Answer:A full-time plumber in Gillette, WY earns a median $59,363/year (≈ $28.54/hour) in nominal terms for 2026 — projected from BLS OEWS 2025 (SOC 47-2152). Once you factor in Gillette's price level (4% below national, BEA RPP 95.8), that paycheck buys what $61,966 would nationally. Nominal pay sits 5.3% below the Wyoming state average.
Based on BLS state-level estimates · View source
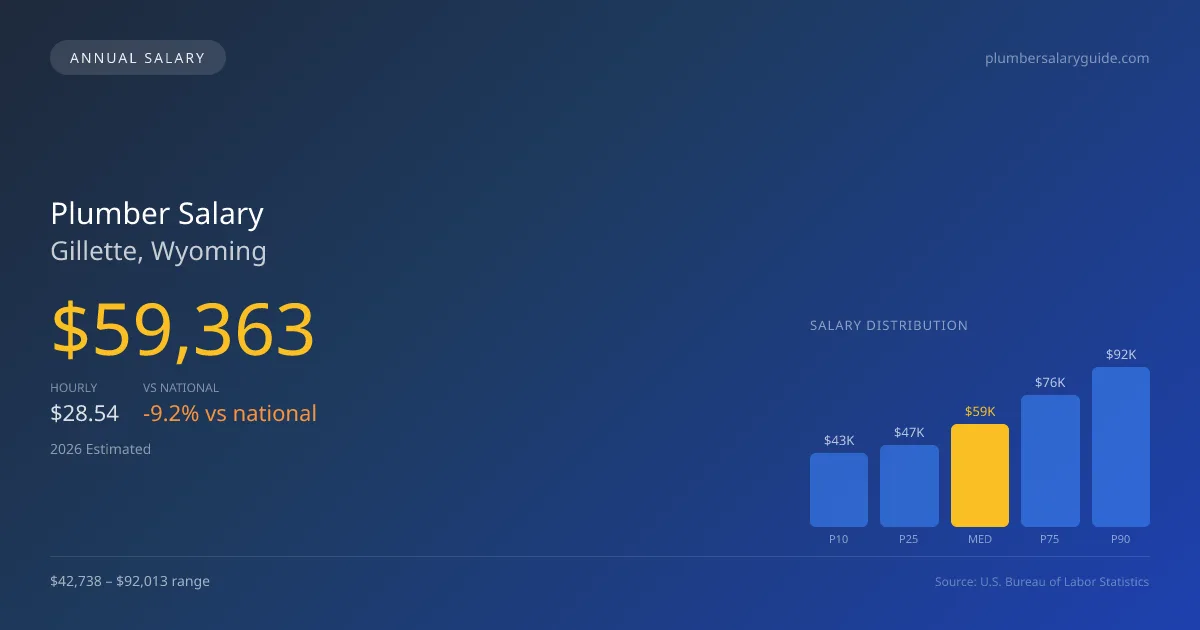
In 2026, the projected median annual salary for plumbers in Gillette, Wyoming, is $59,363, reflecting a slight underperformance compared to the national median of $65,408. Plumbers in this region earn between $42,738 at the lower end and can reach $92,013 at the top tier of the market. These figures derive from BLS state-level data, adjusted for local economic conditions. A noteworthy factor influencing plumber compensation in Gillette is the specialty premium, particularly in medical gas installations, industrial plumbing, and underground utility work, which can significantly elevate earnings and create opportunities for skilled professionals in high-demand sectors.
About the Gillette Market
Salary estimated from Wyoming average ($62,000) adjusted for local cost of living.
Salary Breakdown
| Percentile | Annual | Hourly |
|---|---|---|
| Entry Level (P10) | $42,738 | $20.55 |
| Lower Range (P25) | $47,251 | $22.72 |
| Median (P50)(typical) | $59,363 | $28.54 |
| Upper Range (P75) | $75,985 | $36.53 |
| Top Earners (P90) | $92,013 | $44.24 |
Median Salary Position
9.24% below the national average
2026 Salary Percentile Distribution in Gillette
In Gillette, WY, the plumber salary spread from the 10th to 90th percentile is $49,275 (2026 est.). At $59,363, the local median is 9.24% below the national median of $65,408.
Salary Calculator
At 40 hours/week in Gillette: You'd be in the lower-middle range
How Gillette Plumber Pay Compares
Gillette median: $59,363/year (2026)
| Compared To | Median Salary | Gillette Pays |
|---|---|---|
| Wyoming Average | $62,686 | -5.30% less |
| National Average | $65,408 | -9.24% less |
Plumbers in Gillette, WY earn a median of $59,363 per year (2026 est.), which is 9.24% lower than the national median of $65,408 and 5.30% below the Wyoming state average of $62,686.
Cost-of-Living Adjusted Salary
Gillette has a cost of living 4.20% below the national average, meaning your salary goes further here.
Adjusted salary = nominal × (100 / CoL index). CoL index: 100 = national average.
Gillette, WY has a cost-of-living index of 95.8 (below the national average of 100). A plumber earning $59,363 nominally has purchasing power equivalent to $61,966 in an average-cost city — an effective 4.38% boost.
Compare Purchasing Power
Select a city to see how your salary compares after cost of living
Select a city above to compare purchasing power
2019 BLS Actual
$50,062
2025 BLS Actual
$57,904
2026 Current Est.
$59,363
2019–2027 Growth
+21.6%
Salary Trajectory for Plumbers in Gillette (2019–2027)
2019–2025: actual BLS OEWS data for this metro area. 2026+: CAGR 2.52% projection.
| Year | Annual Salary | Status |
|---|---|---|
| 2019 | $50,062 | Actual |
| 2020 | $51,124 | Actual |
| 2021 | $54,346 | Actual |
| 2022 | $54,537 | Actual |
| 2023 | $55,862 | Actual |
| 2024 | $56,271 | Actual |
| 2025 | $57,904 | Actual |
| 2026(current) | $59,363 | Estimated |
| 2027 | $60,859 | Projected |
Based on 7 years of BLS OEWS data for the Gillette metropolitan area, the median plumber salary grew 15.7% from $50,062 (2019) to $57,904 (2025). At a 2.52% compound annual growth rate, salaries are projected to reach $60,859 by 2027 — a total increase of $10,797 (21.57%) from 2019.
Note: Historical values (2019–2025) are actual BLS OEWS figures for the Gillette metropolitan area, sourced from annual Occupational Employment and Wage Statistics surveys. 2026–2026 figures are current estimates, and 2027 values are projections, calculated using a 2.52% CAGR derived from 7-year BLS historical data. Actual salaries may vary based on employer, experience, certifications, and local market conditions.
Salary by Experience Level
| Experience | Estimated Salary Range |
|---|---|
| 0-2 years (New Graduate) | $42,738 – $47,251 |
| 3-5 years (Mid Career) | $47,251 – $59,363 |
| 5+ years (Experienced) | $59,363 – $75,985 |
| 10+ years (Top Earner) | $75,985 – $92,013 |
Plumber salary ranges estimated from BLS percentile data. Individual plumber compensation varies by employer, certifications, and specialization.
Plumber Job Market in Gillette
With only nine plumbers currently employed in Gillette, the job market remains limited, yet the cost-of-living index stands at 95.8, indicating a slightly more affordable environment than the national average. This reality enhances the take-home purchasing power of wages earned in the area. Among employers, union plumbing contractors tend to offer higher pay, leveraging benefits from UA (United Association) membership, while non-union companies provide competitive rates but less job security. Self-employed plumbers and those working in industrial maintenance teams also have the potential to earn significantly based on their expertise and the complexities of projects undertaken. Factors driving pay disparities include specialization (medical gas and industrial pipefitting tend to yield higher wages), and strategies such as acquiring state plumbing licenses and pursuing master certifications can further enhance earning potential in Gillette's evolving market.
More salary data for Gillette, WY:
Frequently Asked Questions
How much do plumbers make in Gillette, WY in 2026?
Is Gillette, WY a good place to work as a plumber?
Can plumbers make $100K in Gillette?
What is the cost-of-living adjusted plumber salary in Gillette?
How much does a plumber make per hour in Gillette?
Related Pages
Compare Salaries
Career Resources
Nearby Cities in Wyoming
Written by Samuel Torres, CWP
Career Analyst
Samuel Torres has 10 years of experience in plumbing. He specializes in residential plumbing systems. He has worked with several home improvement companies.
Methodology & Data Source
Salary figures on this page are 2026 projections based on the Bureau of Labor Statistics Occupational Employment and Wage Statistics (OEWS) survey, May 2026 release. The BLS reported a median annual salary of $57,904 for plumbersin the Gillette metropolitan area. A 2.52% compound annual growth rate (CAGR), calculated from 6-year national BLS wage trends, was applied to project current 2026 compensation. Percentile ranges (P10–P90) represent the full salary distribution across experience levels and practice settings in this market.
Data Sources & Methodology
Salary data for Gillette is estimated from official BLS state-level occupational wage data (2025), adjusted for regional cost-of-living differences using BEA RPP (Regional Price Parities).
2026 figures are projected from 2025 BLS data using a compound annual growth rate (CAGR) of 2.52%, derived from historical BLS wage trends for plumbers (SOC 47-2152).
Compiled and verified by Samuel Torres, CWP, a licensed plumber with 10+ years of clinical experience. · View source data at BLS.gov