Plumber Hourly Pay in San Jose, CA: $53.01 (2026)
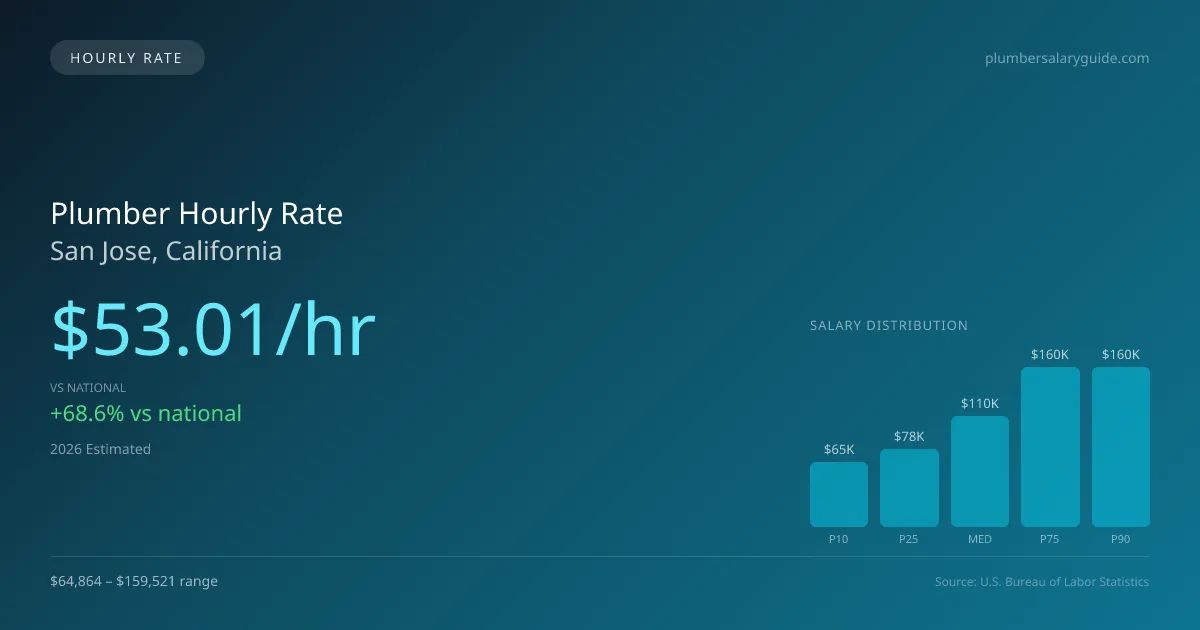
Quick Answer:Hourly pay for a plumber working in San Jose, CA runs $53.01 at the median for 2026 — annualizing to $110,271 at a standard 2,080-hour year. Figures projected from BLS OEWS 2025 (SOC 47-2152). Weighted against San Jose's regional price level (BEA RPP 110.4, 10% above national), each hour of work buys what $48.01 nationally would. A 24-hour part-time schedule grosses $66,160 per year.
Official BLS data · View source
In 2026, the plumber hourly pay in San Jose, California, stands at an impressive $53.01, significantly higher than the national median of $31.45. This substantial hourly rate is beneficial for those working part-time or on a per-diem basis, allowing for flexibility in various environments—from commercial and industrial construction sites to residential service calls and hospital mechanical rooms. As a result, entry-level plumbers can expect to earn around $31.19 per hour, while the highest earners can command rates up to $76.70 per hour. This official BLS data highlights the lucrative opportunities available in San Jose's plumbing market, making it an attractive area for both seasoned professionals and those just starting their careers.
Plumber Hourly Wage Breakdown
| Percentile | Hourly Rate | Per 8hr Shift |
|---|---|---|
| Entry Level (P10) | $31.19 | $249.49 |
| Lower Range (P25) | $37.48 | $299.85 |
| Median (P50) | $53.01 | $424.10 |
| Upper Range (P75) | $76.70 | $613.56 |
| Top Earners (P90) | $76.70 | $613.56 |
Estimated Annual Income by Work Schedule in San Jose
Based on $53.01/hr median hourly rate · 2026 est.
At $53.01/hr, a plumber working full-time (40 hr/wk) in San Jose, CA can expect to earn approximately $110,267 per year (2026 est.). Part-time hygienists working 24 hours per week would earn around $63,616. With a cost-of-living index of 110.42 (above the national average), these earnings may be offset by higher expenses in San Jose.
Hourly Rate Calculator
Schedule Comparison in San Jose
| Schedule | Weekly | Monthly | Annual |
|---|---|---|---|
| Full-Time (40 hrs) | $2,120.52 | $9,189 | $110,267 |
| Part-Time (24 hrs) | $1,272.31 | $5,513 | $66,160 |
| Per Diem (16 hrs) | $848.21 | $3,676 | $44,107 |
Compare Plumber Wages With Similar Roles
| Role | Median Hourly |
|---|---|
| Plumber (San Jose) | $53.01 |
| Electrician (National Avg) | $31.97 |
| HVAC Technician (National Avg) | $28.47 |
| Pipefitter / Steamfitter (National Avg) | $32.85 |
| Construction Laborer (National Avg) | $22.95 |
Plumbers in San Jose, CA earn a median of $110,271 per year (2026 est.), which is 68.59% higher than the national median of $65,408 and 68.30% above the California state average of $65,520.
Plumber Hourly Pay vs. Cost of Living
Working 24h/week at $53.01/hr = $66,160/year (purchasing power: $59,915).
Working 40h/week (full-time) = $110,267/year (purchasing power: $99,859).
CoL index: 110.423 (100 = national average).
2019 BLS Actual
$34.99/hr
2025 BLS Actual
$51.71/hr
2026 Current Est.
$53.01/hr
2019–2027 Growth
+55.3%
Hourly Rate Trajectory for Plumbers in San Jose (2019–2027)
2019–2025: actual BLS OEWS data for this metro area. 2026+: CAGR 2.52% projection.
| Year | Hourly Rate | Status |
|---|---|---|
| 2019 | $34.99/hr | Actual |
| 2020 | $34.78/hr | Actual |
| 2021 | $45.03/hr | Actual |
| 2022 | $39.45/hr | Actual |
| 2023 | $41.52/hr | Actual |
| 2024 | $43.37/hr | Actual |
| 2025 | $51.71/hr | Actual |
| 2026(current) | $53.01/hr | Estimated |
| 2027 | $54.35/hr | Projected |
Based on 7 years of BLS OEWS metropolitan area data, the median hourly rate for plumbers in San Jose grew 47.8% from $34.99/hr (2019) to $51.71/hr (2025). At a 2.52% projected growth rate, hourly pay is expected to reach $54.35/hr by 2027. Part-time and per-diem plumbers can use this multi-year trend to benchmark future contract negotiations.
Note: Historical values (2019–2025) are actual BLS OEWS figures for the San Jose metropolitan area, sourced from annual Occupational Employment and Wage Statistics surveys. 2026–2026 figures are current estimates, and 2027 values are projections, calculated using a 2.52% CAGR derived from 7-year BLS historical data. Actual salaries may vary based on employer, experience, certifications, and local market conditions.
Working as an Hourly Plumber in San Jose
Considering part-time work at approximately 24 hours per week, a plumber in San Jose could earn around $41,686 annually, which is notably less than a full-time counterpart. For those in per-diem roles, particularly in industrial or high-demand projects, there's potential to receive additional per diem of $100-$175 per day, augmenting base wages that range from $40 to $65 per hour. Various employer types influence hourly rates significantly; plumbers working for union contractors often benefit from higher pay due to collective bargaining agreements compared to their non-union counterparts. Additionally, self-employed plumbers in high-cost-of-living areas may clear $100-$180 per hour. However, the trade-off often includes varying levels of benefits; some may choose lower hourly rates for the stability of health insurance. For effective negotiations, plumbers should emphasize their specialized skills, such as medical gas certification or backflow prevention, which can justify higher compensation in an increasingly competitive job market.
More salary data for San Jose, CA:
Frequently Asked Questions
What is the hourly rate for plumbers in San Jose in 2026?
How much do part-time plumbers make in San Jose?
Are plumbers in San Jose paid hourly or salary?
How much does a full-time plumber make per year in San Jose?
Do plumbers earn more per hour working part-time in San Jose?
Related Pages
Compare Salaries
Career Resources
Nearby Cities in California
Written by Samuel Torres, CWP
Career Analyst
Samuel Torres has 10 years of experience in plumbing. He specializes in residential plumbing systems. He has worked with several home improvement companies.
Methodology & Data Source
Hourly wage figures on this page are 2026 projections based on the Bureau of Labor Statistics Occupational Employment and Wage Statistics (OEWS) survey, May 2026 release. A 2.52% compound annual growth rate (CAGR), derived from 6-year national BLS wage trends, was applied to estimate current 2026 hourly rates for plumbers in San Jose. Part-time and full-time income estimates assume consistent weekly hours and do not account for overtime, benefits, or seasonal variation.
Data Sources & Methodology
Source: BLS, OEWS, 7-year dataset (–). Per-city data from annual BLS metropolitan area surveys.
2026 figures are projected from 2025 BLS data using a compound annual growth rate (CAGR) of 2.52%, derived from historical BLS wage trends for plumbers (SOC 47-2152).
Compiled and verified by Samuel Torres, CWP, a licensed plumber with 10+ years of clinical experience. · View source data at BLS.gov