Plumber Hourly Pay in San Luis Obispo, CA: $31.09 (2026)
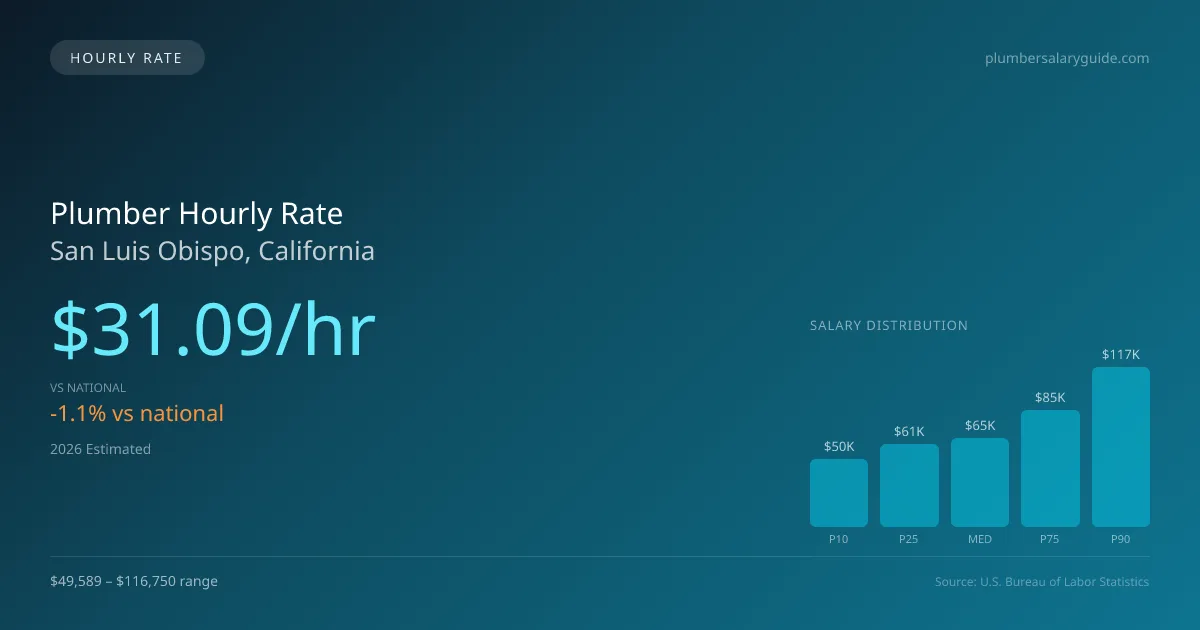
Quick Answer:Hourly pay for a plumber working in San Luis Obispo, CA runs $31.09 at the median for 2026 — annualizing to $64,680 at a standard 2,080-hour year. Figures projected from BLS OEWS 2025 (SOC 47-2152). Weighted against San Luis Obispo's regional price level (BEA RPP 108.6, 9% above national), each hour of work buys what $28.63 nationally would. A 24-hour part-time schedule grosses $38,806 per year.
Official BLS data · View source
In San Luis Obispo, the plumber hourly pay stands at a median of $31.09, slightly below the national median hourly rate of $31.45. This rate is indicative of what plumbers can expect while working across various environments, including residential service calls, industrial construction sites, and hospital mechanical rooms. With a typical range from $23.84 to $56.13 per hour, entry-level workers have a starting point that allows for gradual growth as they gain experience and credentials. The variety of settings in which plumbers operate—ranging from commercial projects to specialized medical gas installations—means that part-time and per-diem plumbers can capitalize on this hourly wage structure while enjoying flexible schedules. Officially reported figures from the Bureau of Labor Statistics indicate that this diverse landscape in San Luis Obispo benefits both the employed and self-employed, offering a compelling path for a sustainable career in plumbing.
Plumber Hourly Wage Breakdown
| Percentile | Hourly Rate | Per 8hr Shift |
|---|---|---|
| Entry Level (P10) | $23.84 | $190.69 |
| Lower Range (P25) | $29.10 | $232.76 |
| Median (P50) | $31.09 | $248.75 |
| Upper Range (P75) | $40.96 | $327.65 |
| Top Earners (P90) | $56.13 | $449.04 |
Estimated Annual Income by Work Schedule in San Luis Obispo
Based on $31.09/hr median hourly rate · 2026 est.
At $31.09/hr, a plumber working full-time (40 hr/wk) in San Luis Obispo, CA can expect to earn approximately $64,676 per year (2026 est.). Part-time hygienists working 24 hours per week would earn around $37,313. With a cost-of-living index of 108.60 (above the national average), these earnings may be offset by higher expenses in San Luis Obispo.
Hourly Rate Calculator
Schedule Comparison in San Luis Obispo
| Schedule | Weekly | Monthly | Annual |
|---|---|---|---|
| Full-Time (40 hrs) | $1,243.77 | $5,390 | $64,676 |
| Part-Time (24 hrs) | $746.26 | $3,234 | $38,806 |
| Per Diem (16 hrs) | $497.51 | $2,156 | $25,870 |
Compare Plumber Wages With Similar Roles
| Role | Median Hourly |
|---|---|
| Plumber (San Luis Obispo) | $31.09 |
| Electrician (National Avg) | $31.97 |
| HVAC Technician (National Avg) | $28.47 |
| Pipefitter / Steamfitter (National Avg) | $32.85 |
| Construction Laborer (National Avg) | $22.95 |
Plumbers in San Luis Obispo, CA earn a median of $64,680 per year (2026 est.), which is 1.11% lower than the national median of $65,408 and 1.30% below the California state average of $65,532.
Plumber Hourly Pay vs. Cost of Living
Working 24h/week at $31.09/hr = $38,806/year (purchasing power: $35,734).
Working 40h/week (full-time) = $64,676/year (purchasing power: $59,557).
CoL index: 108.596 (100 = national average).
2019 BLS Actual
$25.50/hr
2025 BLS Actual
$30.33/hr
2026 Current Est.
$31.09/hr
2019–2027 Growth
+25.0%
Hourly Rate Trajectory for Plumbers in San Luis Obispo (2019–2027)
2019–2025: actual BLS OEWS data for this metro area. 2026+: CAGR 2.52% projection.
| Year | Hourly Rate | Status |
|---|---|---|
| 2019 | $25.50/hr | Actual |
| 2020 | $28.37/hr | Actual |
| 2021 | $29.02/hr | Actual |
| 2022 | $30.01/hr | Actual |
| 2023 | $29.35/hr | Actual |
| 2024 | $29.81/hr | Actual |
| 2025 | $30.33/hr | Actual |
| 2026(current) | $31.09/hr | Estimated |
| 2027 | $31.88/hr | Projected |
Based on 7 years of BLS OEWS metropolitan area data, the median hourly rate for plumbers in San Luis Obispo grew 18.9% from $25.50/hr (2019) to $30.33/hr (2025). At a 2.52% projected growth rate, hourly pay is expected to reach $31.88/hr by 2027. Part-time and per-diem plumbers can use this multi-year trend to benchmark future contract negotiations.
Note: Historical values (2019–2025) are actual BLS OEWS figures for the San Luis Obispo metropolitan area, sourced from annual Occupational Employment and Wage Statistics surveys. 2026–2026 figures are current estimates, and 2027 values are projections, calculated using a 2.52% CAGR derived from 7-year BLS historical data. Actual salaries may vary based on employer, experience, certifications, and local market conditions.
Working as an Hourly Plumber in San Luis Obispo
Part-time plumbers working an average of 24 hours a week could see an annual take-home of around $38,962, a significant decrease compared to full-time earnings. Per diem plumber pay in San Luis Obispo offers an attractive option, particularly for travel pipefitters working on projects outside the area, who can command pay rates between $100 and $175 per day, in addition to a base hourly wage of $40 to $65. For those responding to service calls, minimum charges range from $150 to $300, allowing independent contractors to effectively clear rates between $100 and $180 per hour in high-cost-of-living markets. Employers vary widely, with union plumbers often earning 30-50% premiums over their non-union counterparts. For plumbers looking to negotiate, understanding the benefits associated with union membership versus higher hourly rates without benefits is crucial. These dynamics, coupled with factors like plumbing specialty skills, influence earning potential distinctly across the local San Luis Obispo market.
More salary data for San Luis Obispo, CA:
Frequently Asked Questions
What is the hourly rate for plumbers in San Luis Obispo in 2026?
How much do part-time plumbers make in San Luis Obispo?
Are plumbers in San Luis Obispo paid hourly or salary?
How much does a full-time plumber make per year in San Luis Obispo?
Do plumbers earn more per hour working part-time in San Luis Obispo?
Related Pages
Compare Salaries
Career Resources
Nearby Cities in California
Written by Samuel Torres, CWP
Career Analyst
Samuel Torres has 10 years of experience in plumbing. He specializes in residential plumbing systems. He has worked with several home improvement companies.
Methodology & Data Source
Hourly wage figures on this page are 2026 projections based on the Bureau of Labor Statistics Occupational Employment and Wage Statistics (OEWS) survey, May 2026 release. A 2.52% compound annual growth rate (CAGR), derived from 6-year national BLS wage trends, was applied to estimate current 2026 hourly rates for plumbers in San Luis Obispo. Part-time and full-time income estimates assume consistent weekly hours and do not account for overtime, benefits, or seasonal variation.
Data Sources & Methodology
Source: BLS, OEWS, 7-year dataset (–). Per-city data from annual BLS metropolitan area surveys.
2026 figures are projected from 2025 BLS data using a compound annual growth rate (CAGR) of 2.52%, derived from historical BLS wage trends for plumbers (SOC 47-2152).
Compiled and verified by Samuel Torres, CWP, a licensed plumber with 10+ years of clinical experience. · View source data at BLS.gov