Plumber Salary in Ocala, FL: $51,168 (2026)
Quick Answer:A full-time plumber in Ocala, FL earns a median $51,168/year (≈ $24.60/hour) in nominal terms for 2026 — projected from BLS OEWS 2025 (SOC 47-2152). Once you factor in Ocala's price level (5% below national, BEA RPP 95.2), that paycheck buys what $53,729 would nationally. Nominal pay sits 3.4% below the Florida state average.
Official BLS data · View source
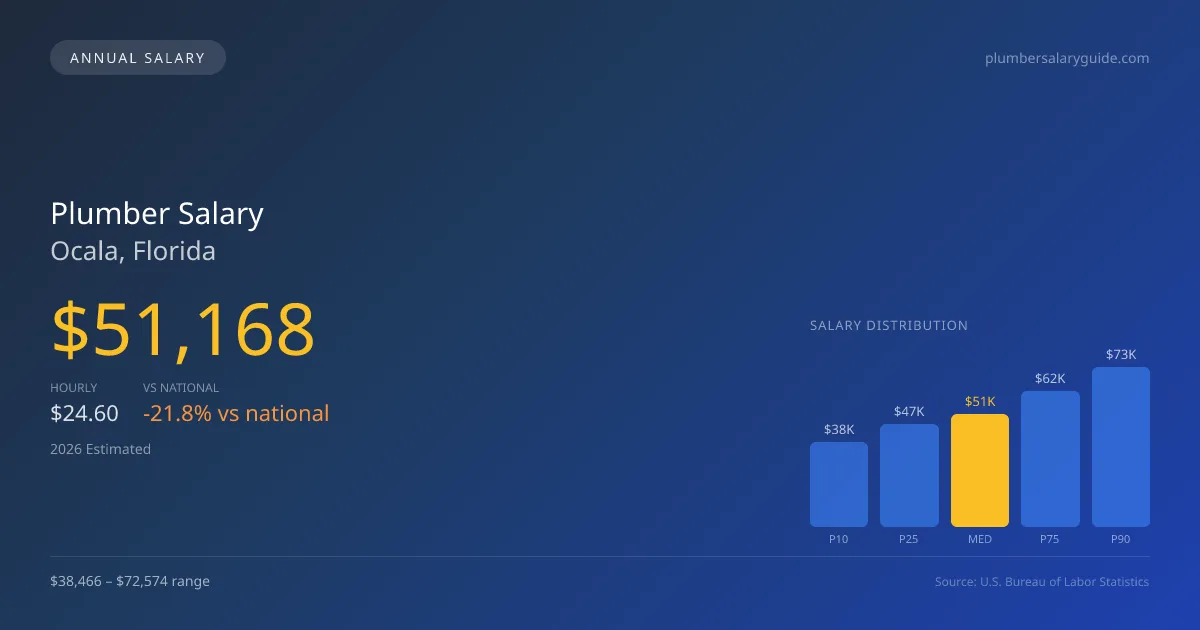
In 2026, plumbers in Ocala, Florida, can expect a median annual salary of $51,168, reflecting a significant gap when compared to the national average of $65,408. The local salary range spans from $38,466 at the 10th percentile to $72,574 at the 90th percentile, illustrating the variances in pay based on experience and specialization. This data, drawn from 2025 BLS OEWS surveys, highlights the dynamics of the job market in Ocala where union pipefitters typically earn a premium over non-union service plumbers, emphasizing the importance of credentials and union affiliations in maximizing income potential within the trades.
Salary Breakdown
| Percentile | Annual | Hourly |
|---|---|---|
| Entry Level (P10) | $38,466 | $18.49 |
| Lower Range (P25) | $46,503 | $22.36 |
| Median (P50)(typical) | $51,168 | $24.60 |
| Upper Range (P75) | $61,881 | $29.75 |
| Top Earners (P90) | $72,574 | $34.90 |
Median Salary Position
21.77% below the national average
2026 Salary Percentile Distribution in Ocala
In Ocala, FL, the plumber salary spread from the 10th to 90th percentile is $34,108 (2026 est.). At $51,168, the local median is 21.77% below the national median of $65,408.
Salary Calculator
At 40 hours/week in Ocala: You'd be in the lower-middle range
How Ocala Plumber Pay Compares
Ocala median: $51,168/year (2026)
| Compared To | Median Salary | Ocala Pays |
|---|---|---|
| Florida Average | $52,969 | -3.40% less |
| National Average | $65,408 | -21.77% less |
Plumbers in Ocala, FL earn a median of $51,168 per year (2026 est.), which is 21.77% lower than the national median of $65,408 and 3.40% below the Florida state average of $52,969.
Cost-of-Living Adjusted Salary
Ocala has a cost of living 4.77% below the national average, meaning your salary goes further here.
Adjusted salary = nominal × (100 / CoL index). CoL index: 100 = national average.
Ocala, FL has a cost-of-living index of 95.234 (below the national average of 100). A plumber earning $51,168 nominally has purchasing power equivalent to $53,729 in an average-cost city — an effective 5.01% boost.
Compare Purchasing Power
Select a city to see how your salary compares after cost of living
Select a city above to compare purchasing power
2019 BLS Actual
$39,340
2025 BLS Actual
$49,910
2026 Current Est.
$51,168
2019–2027 Growth
+33.3%
Salary Trajectory for Plumbers in Ocala (2019–2027)
2019–2025: actual BLS OEWS data for this metro area. 2026+: CAGR 2.52% projection.
| Year | Annual Salary | Status |
|---|---|---|
| 2019 | $39,340 | Actual |
| 2020 | $43,720 | Actual |
| 2021 | $44,080 | Actual |
| 2022 | $43,900 | Actual |
| 2023 | $46,400 | Actual |
| 2024 | $47,230 | Actual |
| 2025 | $49,910 | Actual |
| 2026(current) | $51,168 | Estimated |
| 2027 | $52,457 | Projected |
Based on 7 years of BLS OEWS data for the Ocala metropolitan area, the median plumber salary grew 26.9% from $39,340 (2019) to $49,910 (2025). At a 2.52% compound annual growth rate, salaries are projected to reach $52,457 by 2027 — a total increase of $13,117 (33.34%) from 2019.
Note: Historical values (2019–2025) are actual BLS OEWS figures for the Ocala metropolitan area, sourced from annual Occupational Employment and Wage Statistics surveys. 2026–2026 figures are current estimates, and 2027 values are projections, calculated using a 2.52% CAGR derived from 7-year BLS historical data. Actual salaries may vary based on employer, experience, certifications, and local market conditions.
Salary by Experience Level
| Experience | Estimated Salary Range |
|---|---|
| 0-2 years (New Graduate) | $38,466 – $46,503 |
| 3-5 years (Mid Career) | $46,503 – $51,168 |
| 5+ years (Experienced) | $51,168 – $61,881 |
| 10+ years (Top Earner) | $61,881 – $72,574 |
Plumber salary ranges estimated from BLS percentile data. Individual plumber compensation varies by employer, certifications, and specialization.
Plumber Job Market in Ocala
With 420 plumbers currently employed in the area, Ocala's job market remains stable, especially given the cost of living index at 95.234, which is lower than the national average. This suggests that although plumber salaries in Ocala may trail behind national figures, the purchasing power of local wages could be more favorable. Employers such as UA union contractors offer the highest pay, often significantly exceeding non-union firms due to the benefits of union membership. Additionally, areas such as medical gas and industrial plumbing represent lucrative niches that drive higher earnings. For plumbers looking to boost their income, securing specialized licenses, pursuing commission-based roles in larger service companies, or gaining experience in high-demand sectors are recommended strategies in the competitive Ocala plumbing market.
More salary data for Ocala, FL:
Frequently Asked Questions
How much do plumbers make in Ocala, FL in 2026?
Is Ocala, FL a good place to work as a plumber?
Can plumbers make $100K in Ocala?
What is the cost-of-living adjusted plumber salary in Ocala?
How much does a plumber make per hour in Ocala?
Related Pages
Compare Salaries
Career Resources
Nearby Cities in Florida
Written by Samuel Torres, CWP
Career Analyst
Samuel Torres has 10 years of experience in plumbing. He specializes in residential plumbing systems. He has worked with several home improvement companies.
Methodology & Data Source
Salary figures on this page are 2026 projections based on the Bureau of Labor Statistics Occupational Employment and Wage Statistics (OEWS) survey, May 2026 release. The BLS reported a median annual salary of $49,910 for plumbersin the Ocala metropolitan area. A 2.52% compound annual growth rate (CAGR), calculated from 6-year national BLS wage trends, was applied to project current 2026 compensation. Percentile ranges (P10–P90) represent the full salary distribution across experience levels and practice settings in this market.
Data Sources & Methodology
Source: BLS, OEWS, 7-year dataset (–). Per-city data from annual BLS metropolitan area surveys.
2026 figures are projected from 2025 BLS data using a compound annual growth rate (CAGR) of 2.52%, derived from historical BLS wage trends for plumbers (SOC 47-2152).
Compiled and verified by Samuel Torres, CWP, a licensed plumber with 10+ years of clinical experience. · View source data at BLS.gov