Plumber Salary in Maple Grove, MN: $88,387 (2026)
Quick Answer:A full-time plumber in Maple Grove, MN earns a median $88,387/year (≈ $42.49/hour) in nominal terms for 2026 — projected from BLS OEWS 2025 (SOC 47-2152). Once you factor in Maple Grove's price level (1% below national, BEA RPP 98.5), that paycheck buys what $89,733 would nationally. Nominal pay sits 1.4% above the Minnesota state average.
Based on BLS state-level estimates · View source
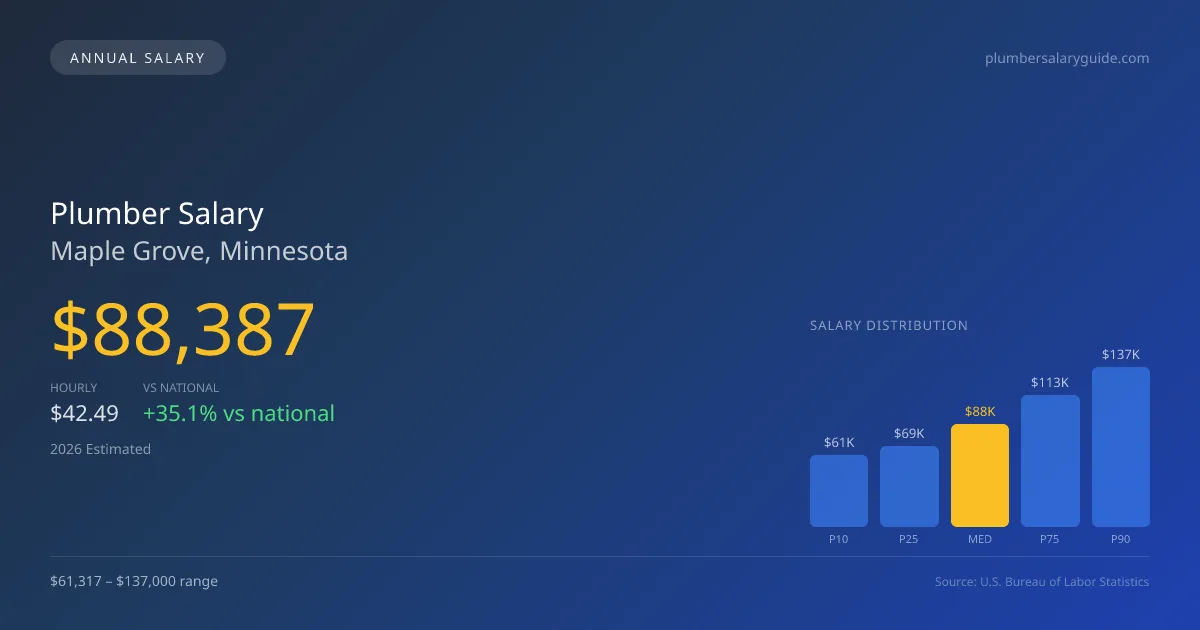
In 2026, plumbers in Maple Grove, Minnesota, can expect a median annual salary of $88,387, significantly higher than the national median of $65,408. The local salary range is substantial, with the lowest earners at $61,317 (P10) and those at the upper end earning up to $137,000 (P90). These figures are derived from 2025 BLS data and adjusted for regional economic conditions. The market for plumbers in Maple Grove is influenced heavily by union versus non-union distinctions, where UA union pipefitters typically earn 30-50% more than their non-union counterparts. This strong pay differential highlights a competitive job market, attracting skilled professionals and contributing to a robust local economy.
About the Maple Grove Market
Salary estimated from Minnesota average ($78,000) adjusted for local cost of living.
Salary Breakdown
| Percentile | Annual | Hourly |
|---|---|---|
| Entry Level (P10) | $61,317 | $29.47 |
| Lower Range (P25) | $68,985 | $33.17 |
| Median (P50)(typical) | $88,387 | $42.49 |
| Upper Range (P75) | $113,135 | $54.39 |
| Top Earners (P90) | $137,000 | $65.87 |
Median Salary Position
35.13% above the national average
2026 Salary Percentile Distribution in Maple Grove
In Maple Grove, MN, the plumber salary spread from the 10th to 90th percentile is $75,683 (2026 est.). At $88,387, the local median is 35.13% above the national median of $65,408.
Salary Calculator
At 40 hours/week in Maple Grove: You'd be in the lower-middle range
How Maple Grove Plumber Pay Compares
Maple Grove median: $88,387/year (2026)
| Compared To | Median Salary | Maple Grove Pays |
|---|---|---|
| Minnesota Average | $87,166 | +1.40% more |
| National Average | $65,408 | +35.13% more |
Plumbers in Maple Grove, MN earn a median of $88,387 per year (2026 est.), which is 35.13% higher than the national median of $65,408 and 1.40% above the Minnesota state average of $87,166.
Cost-of-Living Adjusted Salary
Maple Grove has a cost of living 1.50% below the national average, meaning your salary goes further here.
Adjusted salary = nominal × (100 / CoL index). CoL index: 100 = national average.
Maple Grove, MN has a cost-of-living index of 98.5 (below the national average of 100). A plumber earning $88,387 nominally has purchasing power equivalent to $89,733 in an average-cost city — an effective 1.52% boost.
Compare Purchasing Power
Select a city to see how your salary compares after cost of living
Select a city above to compare purchasing power
2019 BLS Actual
$74,539
2025 BLS Actual
$86,214
2026 Current Est.
$88,387
2019–2027 Growth
+21.6%
Salary Trajectory for Plumbers in Maple Grove (2019–2027)
2019–2025: actual BLS OEWS data for this metro area. 2026+: CAGR 2.52% projection.
| Year | Annual Salary | Status |
|---|---|---|
| 2019 | $74,539 | Actual |
| 2020 | $76,120 | Actual |
| 2021 | $80,917 | Actual |
| 2022 | $81,201 | Actual |
| 2023 | $83,174 | Actual |
| 2024 | $77,872 | Actual |
| 2025 | $86,214 | Actual |
| 2026(current) | $88,387 | Estimated |
| 2027 | $90,614 | Projected |
Based on 7 years of BLS OEWS data for the Maple Grove metropolitan area, the median plumber salary grew 15.7% from $74,539 (2019) to $86,214 (2025). At a 2.52% compound annual growth rate, salaries are projected to reach $90,614 by 2027 — a total increase of $16,075 (21.57%) from 2019.
Note: Historical values (2019–2025) are actual BLS OEWS figures for the Maple Grove metropolitan area, sourced from annual Occupational Employment and Wage Statistics surveys. 2026–2026 figures are current estimates, and 2027 values are projections, calculated using a 2.52% CAGR derived from 7-year BLS historical data. Actual salaries may vary based on employer, experience, certifications, and local market conditions.
Salary by Experience Level
| Experience | Estimated Salary Range |
|---|---|
| 0-2 years (New Graduate) | $61,317 – $68,985 |
| 3-5 years (Mid Career) | $68,985 – $88,387 |
| 5+ years (Experienced) | $88,387 – $113,135 |
| 10+ years (Top Earner) | $113,135 – $137,000 |
Plumber salary ranges estimated from BLS percentile data. Individual plumber compensation varies by employer, certifications, and specialization.
Plumber Job Market in Maple Grove
With 14 plumbers employed in the vicinity, Maple Grove showcases a tight-knit job market, but its cost of living index of 98.5 indicates that earning power remains significant, even when compared to national averages. Employers like UA union contractors generally offer the highest wages, reflecting their commitment to skilled labor, while self-employed plumbers may face fluctuations in income based on job availability and demand. The spread between lower and higher wages in this sector often results from various factors, including the specialization required for medical gas and industrial plumbing versus more conventional residential services. For those looking to maximize their income in Maple Grove, obtaining additional certifications and licenses, particularly in high-demand specialties, can lead to better pay. Additionally, strategically negotiating commission structures with service companies or exploring opportunities with municipal water utilities may improve overall compensation.
More salary data for Maple Grove, MN:
Frequently Asked Questions
How much do plumbers make in Maple Grove, MN in 2026?
Is Maple Grove, MN a good place to work as a plumber?
Can plumbers make $100K in Maple Grove?
What is the cost-of-living adjusted plumber salary in Maple Grove?
How much does a plumber make per hour in Maple Grove?
Related Pages
Compare Salaries
Career Resources
Nearby Cities in Minnesota
Written by Samuel Torres, CWP
Career Analyst
Samuel Torres has 10 years of experience in plumbing. He specializes in residential plumbing systems. He has worked with several home improvement companies.
Methodology & Data Source
Salary figures on this page are 2026 projections based on the Bureau of Labor Statistics Occupational Employment and Wage Statistics (OEWS) survey, May 2026 release. The BLS reported a median annual salary of $86,214 for plumbersin the Maple Grove metropolitan area. A 2.52% compound annual growth rate (CAGR), calculated from 6-year national BLS wage trends, was applied to project current 2026 compensation. Percentile ranges (P10–P90) represent the full salary distribution across experience levels and practice settings in this market.
Data Sources & Methodology
Salary data for Maple Grove is estimated from official BLS state-level occupational wage data (2025), adjusted for regional cost-of-living differences using BEA RPP (Regional Price Parities).
2026 figures are projected from 2025 BLS data using a compound annual growth rate (CAGR) of 2.52%, derived from historical BLS wage trends for plumbers (SOC 47-2152).
Compiled and verified by Samuel Torres, CWP, a licensed plumber with 10+ years of clinical experience. · View source data at BLS.gov