Plumber Salary in Shakopee, MN: $84,462 (2026)
Quick Answer:A full-time plumber in Shakopee, MN earns a median $84,462/year (≈ $40.61/hour) in nominal terms for 2026 — projected from BLS OEWS 2025 (SOC 47-2152). Once you factor in Shakopee's price level (1% below national, BEA RPP 98.5), that paycheck buys what $85,748 would nationally. Nominal pay sits 3.1% below the Minnesota state average.
Based on BLS state-level estimates · View source
In Shakopee, Minnesota, plumbers can anticipate a median annual salary of $84,462 in 2026, which represents a significant 29.13% increase compared to the national median of $65,408. The salary range for plumbers in this area is projected to span from $63,494 at the 10th percentile to $130,916 at the 90th percentile, indicating a variety of earning potentials based on experience and specialization. Estimates derived from 2025 BLS OEWS data, adjusted for regional price parities, reflect local market dynamics that influence these figures. For those considering a career in plumbing, the trade-off between being a self-employed contractor versus working as an employed service plumber plays a critical role in compensation structures.
About the Shakopee Market
Salary estimated from Minnesota average ($78,000) adjusted for local cost of living.
Salary Breakdown
| Percentile | Annual | Hourly |
|---|---|---|
| Entry Level (P10) | $63,494 | $30.53 |
| Lower Range (P25) | $69,477 | $33.40 |
| Median (P50)(typical) | $84,462 | $40.61 |
| Upper Range (P75) | $108,111 | $51.98 |
| Top Earners (P90) | $130,916 | $62.94 |
Median Salary Position
29.13% above the national average
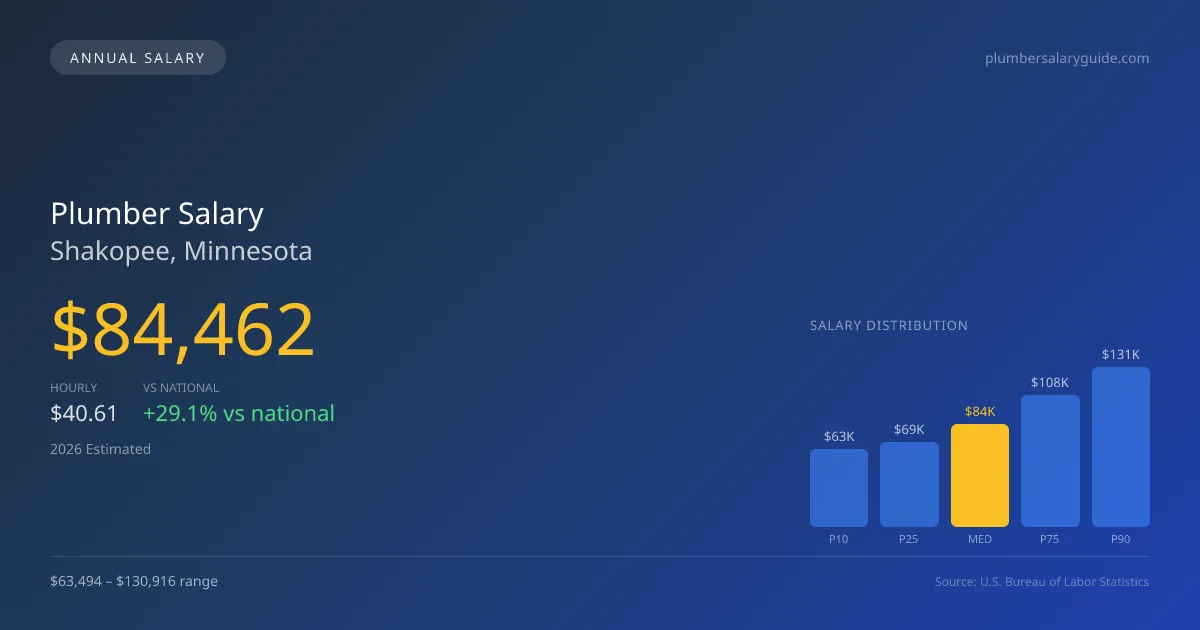
2026 Salary Percentile Distribution in Shakopee
In Shakopee, MN, the plumber salary spread from the 10th to 90th percentile is $67,422 (2026 est.). At $84,462, the local median is 29.13% above the national median of $65,408.
Salary Calculator
At 40 hours/week in Shakopee: You'd be in the lower-middle range
How Shakopee Plumber Pay Compares
Shakopee median: $84,462/year (2026)
| Compared To | Median Salary | Shakopee Pays |
|---|---|---|
| Minnesota Average | $87,164 | -3.10% less |
| National Average | $65,408 | +29.13% more |
Plumbers in Shakopee, MN earn a median of $84,462 per year (2026 est.), which is 29.13% higher than the national median of $65,408 and 3.10% below the Minnesota state average of $87,164.
Cost-of-Living Adjusted Salary
Shakopee has a cost of living 1.50% below the national average, meaning your salary goes further here.
Adjusted salary = nominal × (100 / CoL index). CoL index: 100 = national average.
Shakopee, MN has a cost-of-living index of 98.5 (below the national average of 100). A plumber earning $84,462 nominally has purchasing power equivalent to $85,748 in an average-cost city — an effective 1.52% boost.
Compare Purchasing Power
Select a city to see how your salary compares after cost of living
Select a city above to compare purchasing power
2019 BLS Actual
$71,229
2025 BLS Actual
$82,386
2026 Current Est.
$84,462
2019–2027 Growth
+21.6%
Salary Trajectory for Plumbers in Shakopee (2019–2027)
2019–2025: actual BLS OEWS data for this metro area. 2026+: CAGR 2.52% projection.
| Year | Annual Salary | Status |
|---|---|---|
| 2019 | $71,229 | Actual |
| 2020 | $72,740 | Actual |
| 2021 | $77,324 | Actual |
| 2022 | $77,595 | Actual |
| 2023 | $79,481 | Actual |
| 2024 | $74,415 | Actual |
| 2025 | $82,386 | Actual |
| 2026(current) | $84,462 | Estimated |
| 2027 | $86,591 | Projected |
Based on 7 years of BLS OEWS data for the Shakopee metropolitan area, the median plumber salary grew 15.7% from $71,229 (2019) to $82,386 (2025). At a 2.52% compound annual growth rate, salaries are projected to reach $86,591 by 2027 — a total increase of $15,362 (21.57%) from 2019.
Note: Historical values (2019–2025) are actual BLS OEWS figures for the Shakopee metropolitan area, sourced from annual Occupational Employment and Wage Statistics surveys. 2026–2026 figures are current estimates, and 2027 values are projections, calculated using a 2.52% CAGR derived from 7-year BLS historical data. Actual salaries may vary based on employer, experience, certifications, and local market conditions.
Salary by Experience Level
| Experience | Estimated Salary Range |
|---|---|
| 0-2 years (New Graduate) | $63,494 – $69,477 |
| 3-5 years (Mid Career) | $69,477 – $84,462 |
| 5+ years (Experienced) | $84,462 – $108,111 |
| 10+ years (Top Earner) | $108,111 – $130,916 |
Plumber salary ranges estimated from BLS percentile data. Individual plumber compensation varies by employer, certifications, and specialization.
Plumber Job Market in Shakopee
The local job market in Shakopee currently employs 11 plumbers, a relatively small workforce reflective of the area's modest size. With a cost-of-living index of 98.5, plumbers' take-home pay is boosted by lower living expenses compared to national averages, enhancing their purchasing power. Notably, those working with union plumbing contractors usually command higher wages, whereas non-union and self-employed plumbers may experience a wider pay disparity due to the nature of their work and the demand for specialty skills such as medical gas installation or backflow prevention certification. Competition for skilled labor continues to intensify as the average age of plumbers approaches 50. To maximize earnings, career progression through gaining advanced licenses or certifications, such as master licensing, and exploring paths in high-demand sectors like industrial maintenance or governmental utilities is advisable.
More salary data for Shakopee, MN:
Frequently Asked Questions
How much do plumbers make in Shakopee, MN in 2026?
Is Shakopee, MN a good place to work as a plumber?
Can plumbers make $100K in Shakopee?
What is the cost-of-living adjusted plumber salary in Shakopee?
How much does a plumber make per hour in Shakopee?
Related Pages
Compare Salaries
Career Resources
Nearby Cities in Minnesota
Written by Samuel Torres, CWP
Career Analyst
Samuel Torres has 10 years of experience in plumbing. He specializes in residential plumbing systems. He has worked with several home improvement companies.
Methodology & Data Source
Salary figures on this page are 2026 projections based on the Bureau of Labor Statistics Occupational Employment and Wage Statistics (OEWS) survey, May 2026 release. The BLS reported a median annual salary of $82,386 for plumbersin the Shakopee metropolitan area. A 2.52% compound annual growth rate (CAGR), calculated from 6-year national BLS wage trends, was applied to project current 2026 compensation. Percentile ranges (P10–P90) represent the full salary distribution across experience levels and practice settings in this market.
Data Sources & Methodology
Salary data for Shakopee is estimated from official BLS state-level occupational wage data (2025), adjusted for regional cost-of-living differences using BEA RPP (Regional Price Parities).
2026 figures are projected from 2025 BLS data using a compound annual growth rate (CAGR) of 2.52%, derived from historical BLS wage trends for plumbers (SOC 47-2152).
Compiled and verified by Samuel Torres, CWP, a licensed plumber with 10+ years of clinical experience. · View source data at BLS.gov