Plumber Salary in Danville, VA: $56,643 (2026)
Quick Answer:A full-time plumber in Danville, VA earns a median $56,643/year (≈ $27.23/hour) in nominal terms for 2026 — projected from BLS OEWS 2025 (SOC 47-2152). Once you factor in Danville's price level (3% above national, BEA RPP 103.2), that paycheck buys what $54,887 would nationally. Nominal pay sits 2.2% below the Virginia state average.
Based on BLS state-level estimates · View source
In 2026, the median plumber salary in Danville is projected at $56,643, which is noticeably lower than the national median of $65,408, reflecting a difference of 13.40%. The local salary range varies significantly, with entry-level positions starting around $39,030 and experienced plumbers earning up to $87,797 according to estimates derived from 2025 BLS data. This disparity highlights the potential for substantial earnings, particularly for those with specialized skills in medical gas, underground utility work, or industrial plumbing. Given Danville's local job market, which employs only seven plumbers, those seeking high-level positions in this area may find room for negotiation, especially if they can demonstrate advanced credentials or experience in high-demand specialty areas.
About the Danville Market
Salary estimated from Virginia average ($60,000) adjusted for local cost of living.
Salary Breakdown
| Percentile | Annual | Hourly |
|---|---|---|
| Entry Level (P10) | $39,030 | $18.76 |
| Lower Range (P25) | $43,794 | $21.06 |
| Median (P50)(typical) | $56,643 | $27.23 |
| Upper Range (P75) | $72,503 | $34.86 |
| Top Earners (P90) | $87,797 | $42.21 |
Median Salary Position
13.4% below the national average
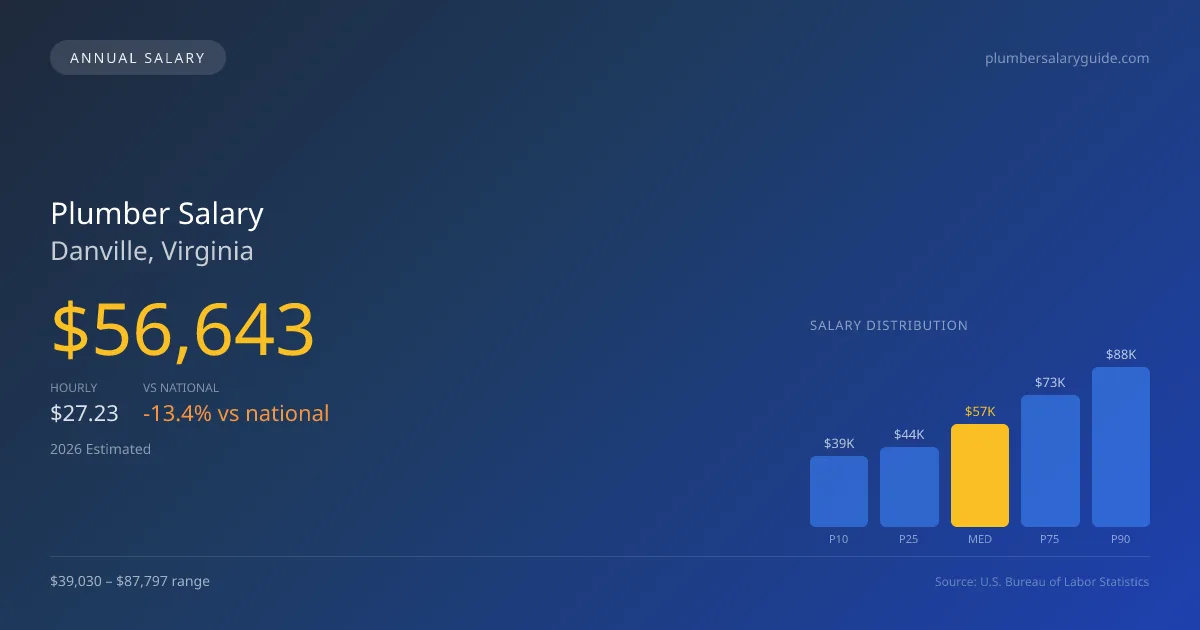
2026 Salary Percentile Distribution in Danville
In Danville, VA, the plumber salary spread from the 10th to 90th percentile is $48,767 (2026 est.). At $56,643, the local median is 13.4% below the national median of $65,408.
Salary Calculator
At 40 hours/week in Danville: You'd be in the lower-middle range
How Danville Plumber Pay Compares
Danville median: $56,643/year (2026)
| Compared To | Median Salary | Danville Pays |
|---|---|---|
| Virginia Average | $57,918 | -2.20% less |
| National Average | $65,408 | -13.40% less |
Plumbers in Danville, VA earn a median of $56,643 per year (2026 est.), which is 13.40% lower than the national median of $65,408 and 2.20% below the Virginia state average of $57,918.
Cost-of-Living Adjusted Salary
Danville has a cost of living 3.20% above the national average.
Adjusted salary = nominal × (100 / CoL index). CoL index: 100 = national average.
Danville, VA has a cost-of-living index of 103.2 (above the national average of 100). While the nominal salary of $56,643 is competitive, the higher cost of living reduces purchasing power to an effective $54,887 — a 3.1% reduction.
Compare Purchasing Power
Select a city to see how your salary compares after cost of living
Select a city above to compare purchasing power
2019 BLS Actual
$47,769
2025 BLS Actual
$55,251
2026 Current Est.
$56,643
2019–2027 Growth
+21.6%
Salary Trajectory for Plumbers in Danville (2019–2027)
2019–2025: actual BLS OEWS data for this metro area. 2026+: CAGR 2.52% projection.
| Year | Annual Salary | Status |
|---|---|---|
| 2019 | $47,769 | Actual |
| 2020 | $48,782 | Actual |
| 2021 | $51,856 | Actual |
| 2022 | $52,038 | Actual |
| 2023 | $53,302 | Actual |
| 2024 | $60,540 | Actual |
| 2025 | $55,251 | Actual |
| 2026(current) | $56,643 | Estimated |
| 2027 | $58,071 | Projected |
Based on 7 years of BLS OEWS data for the Danville metropolitan area, the median plumber salary grew 15.7% from $47,769 (2019) to $55,251 (2025). At a 2.52% compound annual growth rate, salaries are projected to reach $58,071 by 2027 — a total increase of $10,302 (21.57%) from 2019.
Note: Historical values (2019–2025) are actual BLS OEWS figures for the Danville metropolitan area, sourced from annual Occupational Employment and Wage Statistics surveys. 2026–2026 figures are current estimates, and 2027 values are projections, calculated using a 2.52% CAGR derived from 7-year BLS historical data. Actual salaries may vary based on employer, experience, certifications, and local market conditions.
Salary by Experience Level
| Experience | Estimated Salary Range |
|---|---|
| 0-2 years (New Graduate) | $39,030 – $43,794 |
| 3-5 years (Mid Career) | $43,794 – $56,643 |
| 5+ years (Experienced) | $56,643 – $72,503 |
| 10+ years (Top Earner) | $72,503 – $87,797 |
Plumber salary ranges estimated from BLS percentile data. Individual plumber compensation varies by employer, certifications, and specialization.
Plumber Job Market in Danville
The employment figures in Danville indicate a tight job market for plumbers, suggesting that the limited workforce can drive higher wages in certain segments. With a cost-of-living index of 103.2, purchasing power is slightly above the national average, impacting how much plumbers can actually retain from their earnings. Among various employers, union plumbing contractors often pay the most, reflecting the higher wages associated with UA (United Association) signatories. Non-union contractors, such as Roto-Rooter or ARS/Rescue Rooter, offer commission-based pay structures that can be lucrative but also unpredictable. Factors like specialized licenses, including medical gas or backflow prevention, and the growing need for skilled labor due to aging infrastructure will influence earnings. Plumbers looking to maximize their pay in Danville should consider enhancing their skills, pursuing union membership, and targeting high-demand segments of the market.
More salary data for Danville, VA:
Frequently Asked Questions
How much do plumbers make in Danville, VA in 2026?
Is Danville, VA a good place to work as a plumber?
Can plumbers make $100K in Danville?
What is the cost-of-living adjusted plumber salary in Danville?
How much does a plumber make per hour in Danville?
Related Pages
Compare Salaries
Career Resources
Nearby Cities in Virginia
Written by Samuel Torres, CWP
Career Analyst
Samuel Torres has 10 years of experience in plumbing. He specializes in residential plumbing systems. He has worked with several home improvement companies.
Methodology & Data Source
Salary figures on this page are 2026 projections based on the Bureau of Labor Statistics Occupational Employment and Wage Statistics (OEWS) survey, May 2026 release. The BLS reported a median annual salary of $55,251 for plumbersin the Danville metropolitan area. A 2.52% compound annual growth rate (CAGR), calculated from 6-year national BLS wage trends, was applied to project current 2026 compensation. Percentile ranges (P10–P90) represent the full salary distribution across experience levels and practice settings in this market.
Data Sources & Methodology
Salary data for Danville is estimated from official BLS state-level occupational wage data (2025), adjusted for regional cost-of-living differences using BEA RPP (Regional Price Parities).
2026 figures are projected from 2025 BLS data using a compound annual growth rate (CAGR) of 2.52%, derived from historical BLS wage trends for plumbers (SOC 47-2152).
Compiled and verified by Samuel Torres, CWP, a licensed plumber with 10+ years of clinical experience. · View source data at BLS.gov