Plumber Salary in Leesburg, VA: $56,091 (2026)
Quick Answer:A full-time plumber in Leesburg, VA earns a median $56,091/year (≈ $26.96/hour) in nominal terms for 2026 — projected from BLS OEWS 2025 (SOC 47-2152). Once you factor in Leesburg's price level (3% above national, BEA RPP 103.2), that paycheck buys what $54,352 would nationally. Nominal pay sits 3.2% below the Virginia state average.
Based on BLS state-level estimates · View source
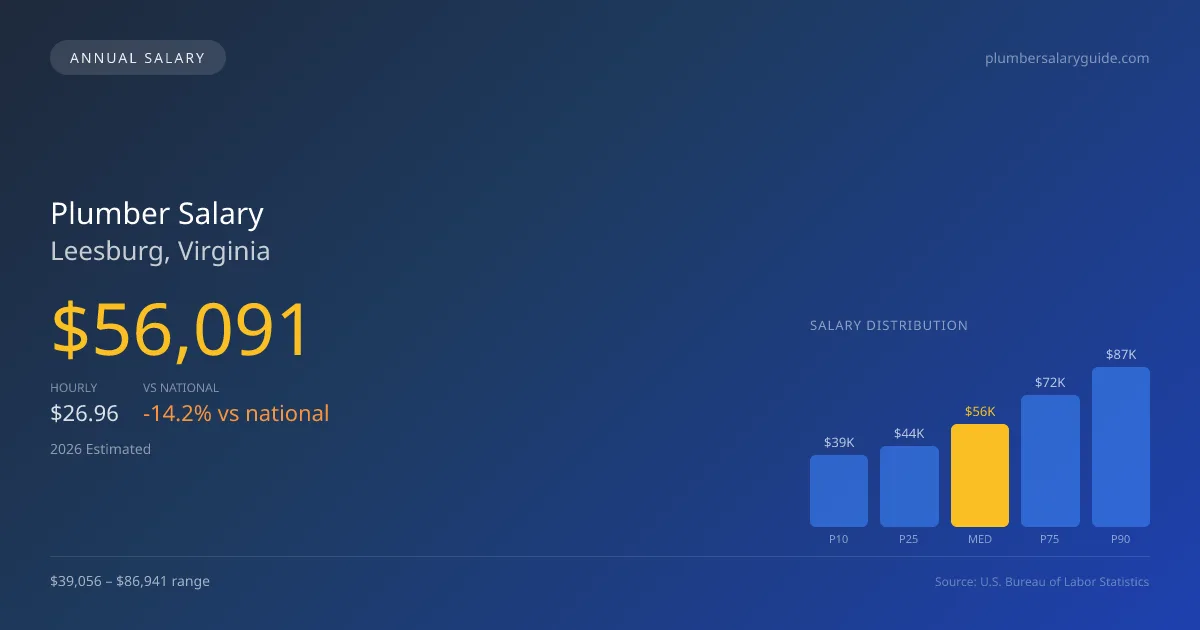
In 2026, the projected median annual salary for a plumber in Leesburg, Virginia, stands at $56,091, a figure that lags approximately 14.24% behind the national median of $65,408. Local plumbers can expect to earn within a wide salary range, starting from $39,056 for the lowest ten percent to a substantial $86,941 for those in the top ten percent. These estimates are derived from BLS state-level data and take into account regional price parities, reflecting the current job market conditions. Union pipefitters, particularly those affiliated with the UA, typically command significantly higher wages than their non-union counterparts, driving the demand for skilled professionals in this area, especially as the industry faces an aging workforce.
About the Leesburg Market
Salary estimated from Virginia average ($60,000) adjusted for local cost of living.
Salary Breakdown
| Percentile | Annual | Hourly |
|---|---|---|
| Entry Level (P10) | $39,056 | $18.78 |
| Lower Range (P25) | $44,058 | $21.18 |
| Median (P50)(typical) | $56,091 | $26.96 |
| Upper Range (P75) | $71,796 | $34.52 |
| Top Earners (P90) | $86,941 | $41.80 |
Median Salary Position
14.24% below the national average
2026 Salary Percentile Distribution in Leesburg
In Leesburg, VA, the plumber salary spread from the 10th to 90th percentile is $47,885 (2026 est.). At $56,091, the local median is 14.24% below the national median of $65,408.
Salary Calculator
At 40 hours/week in Leesburg: You'd be in the lower-middle range
How Leesburg Plumber Pay Compares
Leesburg median: $56,091/year (2026)
| Compared To | Median Salary | Leesburg Pays |
|---|---|---|
| Virginia Average | $57,945 | -3.20% less |
| National Average | $65,408 | -14.24% less |
Plumbers in Leesburg, VA earn a median of $56,091 per year (2026 est.), which is 14.24% lower than the national median of $65,408 and 3.20% below the Virginia state average of $57,945.
Cost-of-Living Adjusted Salary
Leesburg has a cost of living 3.20% above the national average.
Adjusted salary = nominal × (100 / CoL index). CoL index: 100 = national average.
Leesburg, VA has a cost-of-living index of 103.2 (above the national average of 100). While the nominal salary of $56,091 is competitive, the higher cost of living reduces purchasing power to an effective $54,352 — a 3.1% reduction.
Compare Purchasing Power
Select a city to see how your salary compares after cost of living
Select a city above to compare purchasing power
2019 BLS Actual
$47,303
2025 BLS Actual
$54,712
2026 Current Est.
$56,091
2019–2027 Growth
+21.6%
Salary Trajectory for Plumbers in Leesburg (2019–2027)
2019–2025: actual BLS OEWS data for this metro area. 2026+: CAGR 2.52% projection.
| Year | Annual Salary | Status |
|---|---|---|
| 2019 | $47,303 | Actual |
| 2020 | $48,306 | Actual |
| 2021 | $51,350 | Actual |
| 2022 | $51,530 | Actual |
| 2023 | $52,783 | Actual |
| 2024 | $59,950 | Actual |
| 2025 | $54,712 | Actual |
| 2026(current) | $56,091 | Estimated |
| 2027 | $57,504 | Projected |
Based on 7 years of BLS OEWS data for the Leesburg metropolitan area, the median plumber salary grew 15.7% from $47,303 (2019) to $54,712 (2025). At a 2.52% compound annual growth rate, salaries are projected to reach $57,504 by 2027 — a total increase of $10,201 (21.57%) from 2019.
Note: Historical values (2019–2025) are actual BLS OEWS figures for the Leesburg metropolitan area, sourced from annual Occupational Employment and Wage Statistics surveys. 2026–2026 figures are current estimates, and 2027 values are projections, calculated using a 2.52% CAGR derived from 7-year BLS historical data. Actual salaries may vary based on employer, experience, certifications, and local market conditions.
Salary by Experience Level
| Experience | Estimated Salary Range |
|---|---|
| 0-2 years (New Graduate) | $39,056 – $44,058 |
| 3-5 years (Mid Career) | $44,058 – $56,091 |
| 5+ years (Experienced) | $56,091 – $71,796 |
| 10+ years (Top Earner) | $71,796 – $86,941 |
Plumber salary ranges estimated from BLS percentile data. Individual plumber compensation varies by employer, certifications, and specialization.
Plumber Job Market in Leesburg
With only 14 plumbers currently employed in Leesburg, competition for skilled positions remains relatively stable despite the area's higher cost of living, indicated by a cost-of-living index of 103.2. The need for qualified plumbers, especially those with specialties in medical gas or backflow prevention, keeps demand strong in various sectors such as residential service, industrial maintenance, and municipal utilities. Pay disparities in the local market arise largely from the differences between union and non-union roles, with union jobs typically offering 30-50% higher wages. Plumbers aiming to earn more in Leesburg should consider obtaining additional certifications and licenses, seeking employment with union contractors, or considering commission-based positions in service companies, which can lead to higher variances in income based on performance and overtime incentives.
More salary data for Leesburg, VA:
Frequently Asked Questions
How much do plumbers make in Leesburg, VA in 2026?
Is Leesburg, VA a good place to work as a plumber?
Can plumbers make $100K in Leesburg?
What is the cost-of-living adjusted plumber salary in Leesburg?
How much does a plumber make per hour in Leesburg?
Related Pages
Compare Salaries
Career Resources
Nearby Cities in Virginia
Written by Samuel Torres, CWP
Career Analyst
Samuel Torres has 10 years of experience in plumbing. He specializes in residential plumbing systems. He has worked with several home improvement companies.
Methodology & Data Source
Salary figures on this page are 2026 projections based on the Bureau of Labor Statistics Occupational Employment and Wage Statistics (OEWS) survey, May 2026 release. The BLS reported a median annual salary of $54,712 for plumbersin the Leesburg metropolitan area. A 2.52% compound annual growth rate (CAGR), calculated from 6-year national BLS wage trends, was applied to project current 2026 compensation. Percentile ranges (P10–P90) represent the full salary distribution across experience levels and practice settings in this market.
Data Sources & Methodology
Salary data for Leesburg is estimated from official BLS state-level occupational wage data (2025), adjusted for regional cost-of-living differences using BEA RPP (Regional Price Parities).
2026 figures are projected from 2025 BLS data using a compound annual growth rate (CAGR) of 2.52%, derived from historical BLS wage trends for plumbers (SOC 47-2152).
Compiled and verified by Samuel Torres, CWP, a licensed plumber with 10+ years of clinical experience. · View source data at BLS.gov