Plumber Salary in Suffolk, VA: $56,962 (2026)
Quick Answer:A full-time plumber in Suffolk, VA earns a median $56,962/year (≈ $27.38/hour) in nominal terms for 2026 — projected from BLS OEWS 2025 (SOC 47-2152). Once you factor in Suffolk's price level (3% above national, BEA RPP 103.2), that paycheck buys what $55,196 would nationally. Nominal pay sits 1.7% below the Virginia state average.
Based on BLS state-level estimates · View source
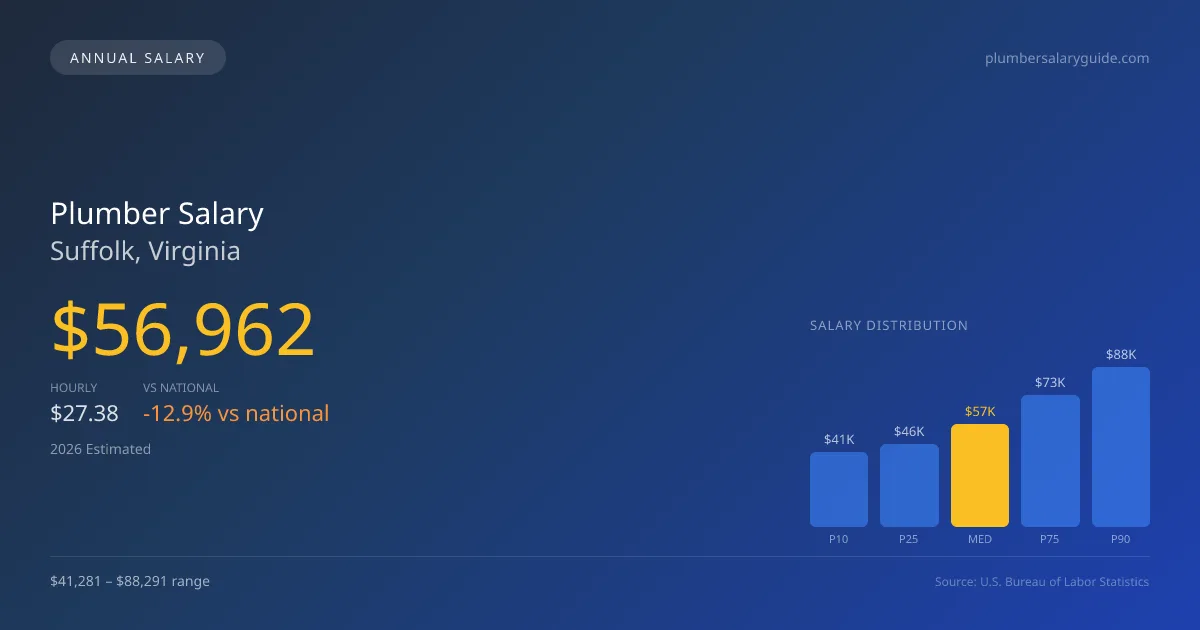
In Suffolk, Virginia, plumbers earn a median salary of $56,962 for 2026, reflecting local economic conditions projected from 2025 BLS data and adjusted for regional price variations. The compensation ranges significantly, from $41,281 at the lower end (P10) to $88,291 at the top (P90). This income potential illustrates the trade-offs between self-employment and working for established plumbing services, where the earnings could fluctuate based on the nature of the projects—a critical consideration for those in the trade. In comparing this local plumber pay in Suffolk, VA with the national median of $65,408, it becomes clear that while the overall salary may lag by nearly 12.91%, the local market still offers a viable path for skilled professionals to thrive within a growing industry.
About the Suffolk Market
Salary estimated from Virginia average ($60,000) adjusted for local cost of living.
Salary Breakdown
| Percentile | Annual | Hourly |
|---|---|---|
| Entry Level (P10) | $41,281 | $19.85 |
| Lower Range (P25) | $45,781 | $22.01 |
| Median (P50)(typical) | $56,962 | $27.38 |
| Upper Range (P75) | $72,911 | $35.05 |
| Top Earners (P90) | $88,291 | $42.44 |
Median Salary Position
12.91% below the national average
2026 Salary Percentile Distribution in Suffolk
In Suffolk, VA, the plumber salary spread from the 10th to 90th percentile is $47,010 (2026 est.). At $56,962, the local median is 12.91% below the national median of $65,408.
Salary Calculator
At 40 hours/week in Suffolk: You'd be in the lower-middle range
How Suffolk Plumber Pay Compares
Suffolk median: $56,962/year (2026)
| Compared To | Median Salary | Suffolk Pays |
|---|---|---|
| Virginia Average | $57,947 | -1.70% less |
| National Average | $65,408 | -12.91% less |
Plumbers in Suffolk, VA earn a median of $56,962 per year (2026 est.), which is 12.91% lower than the national median of $65,408 and 1.70% below the Virginia state average of $57,947.
Cost-of-Living Adjusted Salary
Suffolk has a cost of living 3.20% above the national average.
Adjusted salary = nominal × (100 / CoL index). CoL index: 100 = national average.
Suffolk, VA has a cost-of-living index of 103.2 (above the national average of 100). While the nominal salary of $56,962 is competitive, the higher cost of living reduces purchasing power to an effective $55,196 — a 3.1% reduction.
Compare Purchasing Power
Select a city to see how your salary compares after cost of living
Select a city above to compare purchasing power
2019 BLS Actual
$48,038
2025 BLS Actual
$55,562
2026 Current Est.
$56,962
2019–2027 Growth
+21.6%
Salary Trajectory for Plumbers in Suffolk (2019–2027)
2019–2025: actual BLS OEWS data for this metro area. 2026+: CAGR 2.52% projection.
| Year | Annual Salary | Status |
|---|---|---|
| 2019 | $48,038 | Actual |
| 2020 | $49,057 | Actual |
| 2021 | $52,148 | Actual |
| 2022 | $52,331 | Actual |
| 2023 | $53,603 | Actual |
| 2024 | $60,882 | Actual |
| 2025 | $55,562 | Actual |
| 2026(current) | $56,962 | Estimated |
| 2027 | $58,398 | Projected |
Based on 7 years of BLS OEWS data for the Suffolk metropolitan area, the median plumber salary grew 15.7% from $48,038 (2019) to $55,562 (2025). At a 2.52% compound annual growth rate, salaries are projected to reach $58,398 by 2027 — a total increase of $10,360 (21.57%) from 2019.
Note: Historical values (2019–2025) are actual BLS OEWS figures for the Suffolk metropolitan area, sourced from annual Occupational Employment and Wage Statistics surveys. 2026–2026 figures are current estimates, and 2027 values are projections, calculated using a 2.52% CAGR derived from 7-year BLS historical data. Actual salaries may vary based on employer, experience, certifications, and local market conditions.
Salary by Experience Level
| Experience | Estimated Salary Range |
|---|---|
| 0-2 years (New Graduate) | $41,281 – $45,781 |
| 3-5 years (Mid Career) | $45,781 – $56,962 |
| 5+ years (Experienced) | $56,962 – $72,911 |
| 10+ years (Top Earner) | $72,911 – $88,291 |
Plumber salary ranges estimated from BLS percentile data. Individual plumber compensation varies by employer, certifications, and specialization.
Plumber Job Market in Suffolk
Analyzing the job market in Suffolk reveals that there are currently 15 plumbers employed, which highlights a concentrated workforce in this sector. With a cost-of-living index of 103.2, prospective plumbers must navigate a slightly higher-than-average cost of living, affecting their real purchasing power. Among the local employers, union plumbing contractors tend to offer higher wages due to their structured pay scales and additional benefits compared to non-union or open-shop contractors. Specialties such as medical gas installation not only command premium rates but also require specific credentials, further widening the pay disparity in the market. For those looking to maximize earnings, pursuing union membership, obtaining advanced certifications, and gaining experience in high-demand specialty areas will be crucial tactics to enhance their plumber salary in Suffolk.
More salary data for Suffolk, VA:
Frequently Asked Questions
How much do plumbers make in Suffolk, VA in 2026?
Is Suffolk, VA a good place to work as a plumber?
Can plumbers make $100K in Suffolk?
What is the cost-of-living adjusted plumber salary in Suffolk?
How much does a plumber make per hour in Suffolk?
Related Pages
Compare Salaries
Career Resources
Nearby Cities in Virginia
Written by Samuel Torres, CWP
Career Analyst
Samuel Torres has 10 years of experience in plumbing. He specializes in residential plumbing systems. He has worked with several home improvement companies.
Methodology & Data Source
Salary figures on this page are 2026 projections based on the Bureau of Labor Statistics Occupational Employment and Wage Statistics (OEWS) survey, May 2026 release. The BLS reported a median annual salary of $55,562 for plumbersin the Suffolk metropolitan area. A 2.52% compound annual growth rate (CAGR), calculated from 6-year national BLS wage trends, was applied to project current 2026 compensation. Percentile ranges (P10–P90) represent the full salary distribution across experience levels and practice settings in this market.
Data Sources & Methodology
Salary data for Suffolk is estimated from official BLS state-level occupational wage data (2025), adjusted for regional cost-of-living differences using BEA RPP (Regional Price Parities).
2026 figures are projected from 2025 BLS data using a compound annual growth rate (CAGR) of 2.52%, derived from historical BLS wage trends for plumbers (SOC 47-2152).
Compiled and verified by Samuel Torres, CWP, a licensed plumber with 10+ years of clinical experience. · View source data at BLS.gov